

Newsroom
Sorted by: Latest
-
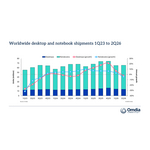
Omdia:供应压力持续加剧,2026年第二季度全球PC市场同比下滑4%
伦敦--(BUSINESS WIRE)--(美国商业资讯)-- 根据Omdia最新研究,2026年第二季度全球台式电脑、笔记本电脑及工作站出货量同比下降3.6%,降至6,570万台。其中,台式电脑(含台式工作站)出货量为1,390万台,同比下降1.3%;笔记本电脑(含移动工作站)出货量为5,170万台,同比下降4.2%。 Omdia首席分析师(Principal Analyst)叶茂盛(Ben Yeh)表示:“今年第一季度存储器和存储产品价格的大幅上涨,对第二季度PC产品定价产生了显著影响。这也促使消费者和企业IT采购决策者提前购买PC,以降低未来价格进一步上涨带来的风险。尽管市场销量目前仍保持相对稳定,但后续需求下滑的风险依然存在。” 近期,苹果上调MacBook产品价格,成为市场关注的焦点。不过,实际上,其他PC厂商早在2025年第四季度末便已开始提价,并在此后的各个季度持续调整产品售价。与去年同期相比,同类产品的价格普遍上涨约20%至40%。 Omdia研究总监Ishan Dutt表示:“今年上半年,市场出现了明显的需求提前释放的迹象。随着供应紧张的影响逐步显现,市场正释放出需求...
-
GPGI Investors Have Opportunity to Join GPGI, Inc. Fraud Investigation with the Schall Law Firm
LOS ANGELES--(BUSINESS WIRE)--GPGI Investors Have Opportunity to Join GPGI, Inc. Fraud Investigation with the Schall Law Firm...
-
CNXC Investors Have Opportunity to Join Concentrix Corporation Fraud Investigation with the Schall Law Firm
LOS ANGELES--(BUSINESS WIRE)--CNXC Investors Have Opportunity to Join Concentrix Corporation Fraud Investigation with the Schall Law Firm...
-
DEWA International se lanza como filial de propiedad absoluta de DEWA para desarrollar proyectos de agua y energía globales
DUBÁI, Emiratos Árabes Unidos--(BUSINESS WIRE)--Su Alteza el Jeque Ahmed bin Saeed Al Maktoum, presidente del Consejo Supremo de Energía de Dubái, anunció la creación de ‘DEWA International’, una filial de propiedad absoluta de Dubai Electricity and Water Authority (DEWA). El objetivo de la empresa es desarrollar proyectos de energía convencional y limpia en todo el mundo y exportar el exitoso modelo de infraestructura de energía y agua de Dubái a mercados globales. Su Alteza el Jeque Ahmed bin...

-
DEWA International lançada como subsidiária independente de propriedade integral da DEWA para desenvolver projetos globais de energia e água
DUBAI, Emirados Árabes Unidos--(BUSINESS WIRE)--Sua Alteza o Xeique Ahmed bin Saeed Al Maktoum, presidente do Conselho Supremo de Energia de Dubai, anunciou o estabelecimento da "DEWA International", subsidiária independente de propriedade integral da Autoridade de Eletricidade e Água de Dubai (DEWA, Dubai Electricity and Water Authority). A empresa tem o objetivo de desenvolver projetos de energia convencional e limpa em todo o mundo e exportar o bem sucedido modelo de infraestrutura energétic...

-
Australian Firms Shift Cybersecurity Focus to Resilience
SYDNEY--(BUSINESS WIRE)--Australian firms are shifting cybersecurity strategies toward integrated approaches that address evolving risks and safe AI adoption, ISG says....
-
为开发全球能源和水务项目,DEWA正式成立其全资独立子公司DEWA International
迪拜,阿联酋--(BUSINESS WIRE)--(美国商业资讯)-- 迪拜最高能源委员会主席Sheikh Ahmed bin Saeed Al Maktoum殿下宣布成立“DEWA International”,这家迪拜水电局(DEWA)的全资独立子公司致力于在全球范围内开发传统能源和清洁能源项目,并将迪拜成功的能源和水务基础设施模式推广至全球市场。 Sheikh Ahmed bin Saeed Al Maktoum殿下表示,“得益于阿联酋副总统兼总理、迪拜酋长Sheikh Mohammed bin Rashid Al Maktoum殿下的远见卓识和指导方针,迪拜已成为成就与加速发展的全球典范。凭借其世界一流的基础设施——特别是在能源和水务领域,迪拜已稳固确立了其作为国际领先标杆的地位。成立DEWA International是一步重要的战略举措,标志着将这一成功模式推广至全球市场、并进一步巩固迪拜在能源、水务、可持续发展和数字化转型领域作为知识与专业经验源泉的地位。” DEWA董事总经理兼首席执行官Saeed Mohammed Al Tayer阁下表示,”从本质上讲,DEWA体现了...

-
DEWA成立旗下全資獨立子公司「DEWA International」,以開發全球能源與水務專案為宗旨
阿拉伯聯合大公國,杜拜--(BUSINESS WIRE)--DEWA International launched as a wholly owned independent subsidiary of DEWA to develop global energy and water projects...

-
Společnost DEWA International byla založena jako plně vlastněná nezávislá dceřiná společnost DEWA za účelem rozvoje globálních projektů v oblasti energetiky a vodního hospodářství
DUBAJ, Spojené arabské emiráty--(BUSINESS WIRE)--Jeho Výsost šejk Ahmed bin Saeed Al Maktoum, předseda Nejvyšší rady pro energetiku v Dubaji, oznámil založení společnosti „DEWA International“, která je stoprocentně vlastněnou nezávislou dceřinou společností Dubajské správy pro elektřinu a vodu (DEWA). Cílem společnosti je rozvíjet projekty v oblasti konvenční i čisté energie po celém světě a exportovat úspěšný model dubajské energetické a vodohospodářské infrastruktury na globální trhy. Jeho Vý...

-
شركة Elliptic تعلن عن مشاركة Circle في برنامج شركاء التصميم القائم على الوكلاء
نيويورك--(BUSINESS WIRE)--أعلنت اليوم شركة Elliptic، الرائدة عالميًا في مجال استخبارات الأصول الرقمية، أنَّ إحدى الشركات التابعة لمجموعة Circle Internet Group, Inc. ("Circle") (بورصة نيويورك: CRCL) قد انضمت إلى برنامج شركاء التصميم القائم على الوكلاء التابع لها، الأمر الذي يسهم في الجمع بين مزوّدي البنية التحتية وفرق الامتثال وقادة التكنولوجيا للمساعدة في تطوير حلول امتثال للأنشطة المالية المستقلة المدعومة بالذكاء الاصطناعي.يأتي هذا الزخم عقب استثمار من Circle Ventures، الذراع الاستثمارية المؤسس...