Newsroom
Sorted by: Latest
-
Canva、Anthropicとの協業を発表し、AI活用デザインを数百万人に提供へ
シドニー--(BUSINESS WIRE)--(ビジネスワイヤ) -- 世界をリードするオールインワン型ビジュアルコミュニケーション・プラットフォームであるCanvaは、Anthropicとの2年間にわたる戦略的協業の次なる展開を発表しました。これによりCanvaは、Anthropic Labsが新たに発表した「Claude Design」に直接組み込まれます。本発表は、ロサンゼルスで開催されたCanvaクリエイトで6,500人の来場者に向けて「Canva AI 2.0」を発表した翌日に行われたものです。 Canvaはまた、HTMLインポート機能を発表しました。この新機能により、Claudeなどのツールで生成されたインタラクティブ・コンテンツをCanvaエディターに簡単に取り込み、ドラッグアンドドロップで共同作業し、調整して公開できるようになります。 この協業により、Claude Designのユーザーは、AIで生成されたドラフトやアイデアをCanva上で完全に編集可能なデザインへと簡単に変換できるようになります。これらのデザインは、共同作業に対応し、ブランドに沿った形で、大規模展開...

-
Canva annonce une collaboration avec Anthropic pour démocratiser le design assisté par l'IA auprès de millions d'utilisateurs
SYDNEY--(BUSINESS WIRE)--Canva, la plateforme de communication visuelle tout-en-un et leader mondial, a annoncé aujourd'hui la prochaine étape de sa collaboration stratégique de deux ans avec Anthropic, intègrant directement Canva à Claude Design, la nouvelle plateforme lancée par Anthropic Labs. Cette annonce a eu lieu au lendemain de la présentation de Canva AI 2.0 devant 6 500 personnes lors de Canva Create à Los Angeles. Canva ajoute également aujourd'hui l'importation HTML, une nouvelle fo...

-
Riassunto: Canva annuncia una collaborazione con Anthropic per portare a milioni di utenti la progettazione basata sull'AI
SYDNEY--(BUSINESS WIRE)--Canva, la piattaforma integrata di comunicazione visiva leader nel mondo, oggi ha svelato il prossimo capitolo della sua strategica collaborazione di due anni con Anthropic: l'integrazione di Canva direttamente nel nuovo Claude Design di Anthropic Labs, a sole 24 ore dalla presentazione di Canva AI 2.0 a un pubblico di 6.500 persone al Canva Create di Los Angeles. Oggi Canva lancia anche l'importazione HTML, una nuova funzionalità che semplifica l'inserimento nell'edito...

-
Canva y Anthropic se unen para llevar el diseño impulsado por IA a millones de personas
SÍDNEY--(BUSINESS WIRE)--Canva, la plataforma integral líder mundial en comunicación visual, anunció hoy una nueva etapa de su colaboración estratégica de dos años con Anthropic: la integración directa de Canva en Claude Design by Anthropic Labs, presentado recientemente, apenas un día después de lanzar Canva AI 2.0 ante una audiencia de 6500 personas en Canva Create, en Los Ángeles. Canva también presentó hoy la importación de HTML, una nueva funcionalidad que permite incorporar fácilmente al...
-
Samenvatting: Canva kondigt samenwerking met Anthropic aan om AI-gestuurd ontwerpen voor miljoenen mensen toegankelijk te maken
SYDNEY--(BUSINESS WIRE)--Canva, ’s werelds toonaangevende alles-in-één platform voor visuele communicatie, heeft vandaag het volgende hoofdstuk aangekondigd in zijn tweejarige strategische samenwerking met Anthropic. Hiermee wordt Canva rechtstreeks geïntegreerd in het onlangs gelanceerde Claude Design van Anthropic Labs. Dit gebeurde een dag nadat Canva AI 2.0 werd gepresenteerd aan een publiek van 6.500 mensen tijdens Canva Create in Los Angeles. Canva introduceert vandaag ook HTML-import, ee...

-
A Canva anunciou uma colaboração com a Anthropic para levar o design impulsionado por IA a milhões de pessoas.
SYDNEY--(BUSINESS WIRE)--A Canva, plataforma líder mundial de comunicação visual, anunciou hoje o próximo capítulo de sua colaboração estratégica de dois anos com a Anthropic. A novidade é a integração do Canva ao recém-lançado Claude Design, da Anthropic Labs, um dia após a empresa revelar o Canva AI 2.0 para um público de 6,5 mil pessoas no Canva Create, em Los Angeles. O Canva também está lançando hoje a importação de HTML, um novo recurso que facilita a transferência de conteúdo interativo...

-
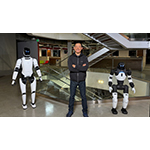
Faraday Future Announces $45 Million in New Financing with a U.S. Institutional Investor to Strongly Support the Execution of Its EAI Robotics & EAI EV Business; Plans to Pursue Long-Term Strategic Cooperation with the Investor for Mutual Benefit
LOS ANGELES--(BUSINESS WIRE)--Faraday Future Intelligent Electric Inc. (NASDAQ: FFAI) (“Faraday Future,” “FF” or the “Company”), a California-based global Embodied AI (EAI) ecosystem company, today announced that the Company has signed a $45 million financing agreement (the “Agreement”) with a U.S. institutional investor (the “Investor”), with the full amount received on the same day. The proceeds will significantly support the execution of the Company’s EAI (Embodied AI) ecosystem strategy. Un...
-
SBCメディカル、普通株式3,100,000株の売出しの価格決定に関するお知らせ
米国カリフォルニア州アーバイン発--(BUSINESS WIRE)--(ビジネスワイヤ) -- 多様な医療分野にわたるフランチャイズ事業を展開するマネジメント・サービス・オーガニゼーションであるSBC Medical Group Holdings Incorporated(Nasdaq:SBC、以下「当社」といいます。)は、本日、相川佳之医師(以下「売出株主」といいます。)による当社普通株式3,100,000株の引受契約に基づく売出し(以下「本売出し」といいます。)について、公開価格を1株当たり3.25米ドルに決定したことを発表いたしました。加えて、売出株主は、引受会社に対し、45日間のオプションとして当社普通株式を最大465,000株まで追加購入する権利を付与しております。本売出しは、通常の取引完了条件に従い、2026年4月21日頃を目処にクロージングする予定です。 なお、本売出しにおいて、当社自身は普通株式の売出しを行っておらず、本売出しによる手取金はすべて売出株主が受領いたします。 本売出しにおいては、Maxim Group LLCが単独の主幹事(sole book-runni...
-
SBC Medical Announces Pricing of Secondary Public Offering of 3.1 Million Shares of Common Stock
IRVINE, Calif.--(BUSINESS WIRE)--SBC Medical Group Holdings Incorporated (Nasdaq: SBC) (“the Company”), a Management Service Organization operating a wide range of franchise businesses across diverse medical fields, today announced the pricing of the underwritten secondary public offering of 3,100,000 shares of the Company’s common stock by Dr. Yoshiyuki Aikawa (the “Selling Stockholder”) at the public offering price of $3.25 per share. Additionally, the Selling Stockholder has granted the unde...
-
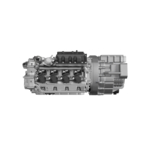
Horse Powertrain Reveals X-Range C15 Direct Drive Powertrain for Hybridizing BEV Platforms
BEIJING--(BUSINESS WIRE)--Horse Powertrain, a global leader in innovative and low-emission powertrain systems, will unveil a new ‘all-in-one’ powertrain at Beijing Auto Show 2026: the X-Range C15 Direct Drive. The ultra-compact X-Range C15 Direct Drive integrates a full hybrid powertrain – including a 4-cylinder engine, transmission, power electronics, and an electric motor – into a single compact unit with a shared housing, designed to mount to the rear subframe enabling a double isolated inst...