Newsroom
Sorted by: Latest
-
First Trust Global Funds PLC UK Regulatory Announcement: Net Asset Value(s)
LONDON--(BUSINESS WIRE)-- Funds Date TIDM ISIN Code Shares in Issue Currency Net Asset Value NAV/per Share First Trust Rising Dividend Achievers UCITS ETF 13.02.2026 RDVY LN IE000K5F6EL4 825,002.00 USD 18,787,393.04 22.773 ...
-
ReNew Announces Results for the Third Quarter of Fiscal 2026 (Q3 FY26) and Nine Months of Fiscal 2026, both ended December 31, 2025
GURUGRAM, India--(BUSINESS WIRE)--ReNew Energy Global Plc today announced its unaudited consolidated IFRS results for Q3 FY26 and nine months ended December 31, 2025....

-
REJO lance le dispositif modulaire CUBE au Japon en première mondiale
TOKYO--(BUSINESS WIRE)--REJO, fournisseur mondial pionnier de solutions de chauffage sans combustion (HNB), a annoncé aujourd’hui le lancement mondial au Japon de REJO CUBE, son dernier dispositif HNB modulaire. S’éloignant des normes de conception HNB conventionnelles, REJO CUBE est une nouvelle option audacieuse avec un design tendance et une expérience d’inhalation à double mode, disponible sur les principaux canaux de vente au détail en ligne japonais à partir du 16 février. Ce lancement ma...

-
Cahill Announces Arrival of Real Estate and Digital Infrastructure Finance Partner Lisa Seifman in the Firm’s London Office
NEW YORK & LONDON--(BUSINESS WIRE)--Cahill Gordon & Reindel LLP is pleased to announce that Lisa Seifman has joined the firm as a partner in the firm’s London office. Lisa will serve as Chair of Cahill’s Real Estate Finance practice group and Co-Chair of Cahill’s Digital Infrastructure Finance practice. Her arrival follows the recent addition of partner Jeremy Duffy, Chair of Cahill’s European Leveraged Finance practice group and Co-Chair of the Digital Infrastructure Finance practice, furt...
-
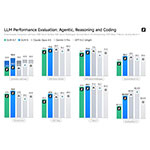
GLM-5 Launch Signals a New Era in AI: When Models Become Engineers
SINGAPORE--(BUSINESS WIRE)--GLM-5, newly released as open source, signals a broader shift in artificial intelligence. Large language models are moving beyond generating code snippets or interface prototypes toward building complete systems and carrying out complex, end-to-end tasks. The change marks a transition from so-called “vibe coding” to what researchers increasingly describe as agentic engineering. Built for this new phase, GLM-5 ranks among the strongest open-source models for coding an...
-
Italy Sees Economic Boost From the Opening Weekend of the Olympic Winter Games Milano Cortina 2026
MILANO, Italy--(BUSINESS WIRE)--Visa, the Official Payment Technology Partner of the Olympic and Paralympic Winter Games, today released new data revealing consumer spending patterns in the Winter Games host locations1 during the opening weekend of the Olympic Winter Games Milano Cortina 2026. VisaNet data analysed by Visa Consulting & Analytics (VCA) shows the positive impact that Milano Cortina 2026 is having on commerce: Overseas Visa cardholders visits rose by more than 60%, with the la...

-
Syngenta Unlocks Wheat’s Potential and Prepares to Launch X-Terra® Hybrid Wheat Across Europe
BASEL, Switzerland--(BUSINESS WIRE)--Wheat is the world’s most genetically complex staple crop, with the wheat genome nearly six times the size of the human genome – making it the most challenging of the world’s staple crops to sequence or study. Syngenta, a world leader in agricultural innovation, is leading the race to leverage advances in genetic technologies, improving wheat’s productivity and resilience while taking wheat breeding to the next level. By screening entire genomes to identify...

-
Syngenta libère le potentiel du blé et se prépare à lancer le blé hybride X-Terra® dans toute l'Europe
BÂLE, Suisse--(BUSINESS WIRE)--Le blé est la culture la plus complexe sur le plan génétique, son génome étant près de six fois plus grand que le génome humain, ce qui en fait la culture la plus difficile à séquencer ou à étudier. Syngenta, leader mondial de l'innovation agricole, est à la pointe des progrès des technologies génétiques améliorant la productivité et la résilience du blé, tout en faisant entrer la sélection variétale du blé dans une nouvelle ère. En analysant des génomes entiers p...

-
Klarna Launches on Google Pay in the UK
LONDON--(BUSINESS WIRE)--Klarna, the global digital bank and flexible payments provider, is now available on Google Pay in the UK. Google Pay users in the U.K. can choose Klarna’s interest-free payment options at checkout. Raji Behal, Head of Western and Southern Europe, UK & Ireland at Klarna, said, “We’re really excited to bring Klarna’s fair, flexible and interest-free payment options to Google Pay users. This is a big moment for us and a major step towards our goal of being available at...
-
Riassunto: REJO lancia il nuovo dispositivo modulare CUBE in anteprima mondiale in Giappone
TOKYO--(BUSINESS WIRE)--REJO, fornitore globale all’avanguardia di soluzioni a tabacco riscaldato non bruciato (HNB, heat-not-burn), ha annunciato oggi il lancio mondiale in Giappone di REJO CUBE, il suo più recente dispositivo HNB modulare. Rompendo gli schemi del design HNB convenzionale, REJO CUBE introduce un’opzione audace caratterizzata da un design di tendenza e da un’esperienza di inalazione a doppia modalità, che sarà lanciata sui principali canali di e-commerce in Giappone il 16 febbr...