

Newsroom
Sorted by: Latest
-
Massachusetts Financial Services Company UK Regulatory Announcement: Form 8.3
LONDON--(BUSINESS WIRE)-- FORM 8.3 PUBLIC OPENING POSITION DISCLOSURE/DEALING DISCLOSURE BY A PERSON WITH INTERESTS IN RELEVANT SECURITIES REPRESENTING 1% OR MORE Rule 8.3 of the Takeover Code (the “Code”) 1. KEY INFORMATION (a) Full name of discloser: Massachusetts Financial Services Company (b) Owner or controller of interests and short positions disclosed, if different from 1(a): The naming of nominee or vehicle companies is insufficient. For a trust, the trustee(s), settlor and beneficia...
-
Samson Rock Capital LLP UK Regulatory Announcement: Form 8.3
LONDON--(BUSINESS WIRE)-- FORM 8.3 PUBLIC OPENING POSITION DISCLOSURE/DEALING DISCLOSURE BY A PERSON WITH INTERESTS IN RELEVANT SECURITIES REPRESENTING 1% OR MORE Rule 8.3 of the Takeover Code (the “Code”) 1. KEY INFORMATION (a) Full name of discloser: SAMSON ROCK CAPITAL LLP (b) Owner or controller of interests and short positions disclosed, if different from 1(a): The naming of nominee or vehicle companies is insufficient. For a trust, the trustee(s), settlor and beneficiaries must be named....
-
Dynamic Map Platform complète sa couverture cartographique HD du Canada d'un océan à l'autre
LIVONIA, Mich.--(BUSINESS WIRE)--Dynamic Map Platform (DMP) annonce l'achèvement de sa carte haute définition couvrant tout le territoire canadien. L'ajout de Terre-Neuve-et-Labrador et de l'Île-du-Prince-Édouard porte la couverture totale de DMP au Canada à 194 144 kilomètres dans les dix provinces, incluant les quatre principales classes de routes. Le kilométrage du Nord-Est canadien élargit la couverture nord-américaine existante de DMP à plus de 1 560 000 kilomètres. Les constructeurs autom...
-
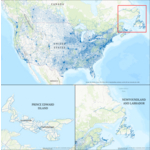
Dynamic Map Platform Completes Coast-to-Coast Canadian HD Map Coverage
LIVONIA, Mich.--(BUSINESS WIRE)--Dynamic Map Platform (DMP) announces the completion of its coast-to-coast high-definition map in Canada. The addition of Newfoundland & Labrador and Prince Edward Island brings DMP's total Canadian coverage to 120,636 miles across all ten provinces including the top four road classes. The Northeast Canadian mileage expands DMP's existing North American coverage to more than 970,000 miles. Automotive OEMs rely on HD maps for safe deployment of ADAS/AV functio...

-
THG Partners With The Trade Desk to Pioneer a New Approach to Retail Media on the Open Internet
LONDON--(BUSINESS WIRE)--THG Ingenuity, the global digital commerce platform, part of The Hut Group, today announces a strategic partnership with global advertising technology leader, The Trade Desk. For the first time, media buyers (advertisers and agencies) can access THG’s segments from Cult Beauty and LOOKFANTASTIC via self-serve across the entire digital ecosystem on The Trade Desk’s media-buying Kokai platform. The new offering meets a growing market demand for increasingly personalised,...
-
First Trust Global Funds PLC UK Regulatory Announcement: Net Asset Value(s)
LONDON--(BUSINESS WIRE)-- Funds Date TIDM ISIN Code Shares in Issue Currency Net Asset Value NAV/per Share First Trust Vest U.S. Equity Buffer UCITS ETF - April 13.02.2026 FAPR.LN IE000WX2HZQ7 150,002.00 USD 3,675,483.63 24.503 ...
-
First Trust Global Funds PLC UK Regulatory Announcement: Net Asset Value(s)
LONDON--(BUSINESS WIRE)-- Funds Date TIDM ISIN Code Shares in Issue Currency Net Asset Value NAV/per Share First Trust Vest Nasdaq-100® Moderate Buffer UCITS ETF - March 13.02.2026 QMAR.LN IE0006S0EBF2 100,002.00 USD 2,278,430.84 22.784 ...
-
First Trust Global Funds PLC UK Regulatory Announcement: Net Asset Value(s)
LONDON--(BUSINESS WIRE)-- Funds Date TIDM ISIN Code Shares in Issue Currency Net Asset Value NAV/per Share First Trust Bloomberg Artificial Intelligence UCITS ETF 13.02.2026 FTAI IE000YIQZ0H6 150,002.00 USD 3,391,032.07 22.607 ...
-
First Trust Global Funds PLC UK Regulatory Announcement: Net Asset Value(s)
LONDON--(BUSINESS WIRE)-- Funds Date TIDM ISIN Code Shares in Issue Currency Net Asset Value NAV/per Share First Trust Vest U.S. Equity Max Buffer UCITS ETF- June 13.02.2026 MJUN LN IE000CO3P697 150,002.00 USD 3,729,611.08 24.864 ...
-
First Trust Global Funds PLC UK Regulatory Announcement: Net Asset Value(s)
LONDON--(BUSINESS WIRE)-- Funds Date TIDM ISIN Code Shares in Issue Currency Net Asset Value NAV/per Share First Trust Vest Nasdaq-100 Moderate Buffer UCITS ETF - December 13.02.2026 QDEC.LN IE000GAKWFA7 450,002.00 USD 10,156,042.64 22.569 ...