

Newsroom
Sorted by: Latest
-
Jacobs secures three strategic UK National Highways contracts
DALLAS--(BUSINESS WIRE)--Jacobs is expanding its significant role in modernizing the U.K.'s infrastructure, securing three new commissions with National Highways....
-
Post-Quantum’s Algorithm - Classic McEliece - Achieves Global ISO Standardization to Protect the World From Quantum Cyber Attack
LONDON--(BUSINESS WIRE)--It’s proven that today’s encryption is vulnerable to attack by a sufficiently mature quantum computer running Shor’s algorithm - a catastrophic event commonly known as Q-Day. Even before such a cryptographically relevant quantum computer emerges it is known that adversaries are stealing encrypted data now, which can be decrypted later - also known as Harvest Now, Decrypt Later (HNDL). Google’s recent use of Artificial Intelligence (AI) to optimise Shor’s algorithm reduc...
-
Computershare Trustees (Jersey) Limited UK Regulatory Announcement: Form 8.3
LONDON--(BUSINESS WIRE)-- FORM 8.3 PUBLIC OPENING POSITION DISCLOSURE/DEALING DISCLOSURE BY A PERSON WITH INTERESTS IN RELEVANT SECURITIES REPRESENTING 1% OR MORE Rule 8.3 of the Takeover Code (the “Code”) 1. KEY INFORMATION (a) Full name of discloser: Computershare Trustees (Jersey) Limited as trustee of the Schroders Employee Benefit Trust (b) Owner or controller of interests and short positions disclosed, if different from 1(a): The naming of nominee or vehicle companies is insufficient. Fo...
-
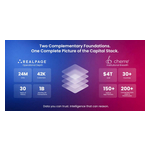
RealPage、Cherreを買収し、不動産資本市場全体を網羅する信頼性の高いAI搭載インテリジェンス・プラットフォームを構築
テキサス州リチャードソン&ニューヨーク--(BUSINESS WIRE)--(ビジネスワイヤ) -- 不動産業界向けにAIを活用したソフトウエアおよびデータ分析ソリューションを提供する大手企業であるRealPage, Inc.は、世界中の機関投資家、不動産投資運用会社、不動産運営事業者から信頼を得ている不動産データ・インテリジェンス企業Cherreの買収を完了したことを発表しました。 RealPageの社長兼最高経営責任者(CEO)であるダーク・ウェイクハムは、次のように述べています。「AIが不動産業界を真に変革するためには、不動産そのものを理解している必要があります。Cherreは、機関投資家やアセットマネジャーが信頼を寄せる、ガバナンスが確保された信頼性の高いインテリジェンスを構築してきました。その専門性をRealPageに取り込むことで、単一物件を管理するお客様から世界規模のポートフォリオを運用するお客様まで、すべてのお客様がより確かな意思決定を支える、より強固で信頼性の高い基盤を利用できるようになります。」 Cherreの共同創業者兼最高経営責任者(CEO)であるL.D.サル...
-
RealPage acquiert Cherre pour créer une plateforme d'intelligence de confiance fondée sur l'IA couvrant l'ensemble de la structure de capital immobilier
RICHARDSON, Texas & NEW YORK--(BUSINESS WIRE)--RealPage, Inc., l'un des principaux fournisseurs de logiciels et d'analyses de données compatibles avec l'IA pour le secteur immobilier, annonce aujourd'hui avoir finalisé l'acquisition de Cherre, une société d'intelligence basés sur des données immobilières fiables pour les propriétaires institutionnels, les gestionnaires d'investissement et les opérateurs du monde entier. « L'IA ne peut transformer l'immobilier que si elle comprend l'immobilier »...

-
Samsung passa a atuar como licenciatária e licenciante do pool Sisvel Wi-Fi Multimode
LUXEMBURGO--(BUSINESS WIRE)--A Samsung Electronics assinou contrato como licenciatária do pool Sisvel Wi-Fi Multimode e também passou a atuar como licenciante no âmbito do programa. A decisão da empresa sul-coreana — uma potência global em P&D e uma das principais fornecedoras de smartphones do mundo, além de líder em muitas outras categorias de produtos eletrônicos — não apenas confirma o pool Sisvel Wi-Fi Multimode como um provedor de soluções reconhecido para partes que buscam reduzir os...

-
RealPage übernimmt Cherre und schafft damit eine bewährte, KI-gestützte Informationsplattform für den gesamten Immobilien-Kapital-Stack
RICHARDSON, Texas & NEW YORK--(BUSINESS WIRE)--RealPage, Inc., ein führender Anbieter von KI-gestützter Software und Datenanalytik für die Immobilienbranche, gab heute bekannt, dass das Unternehmen die Übernahme von Cherre abgeschlossen hat, einem Unternehmen für Immobiliendatenanalytik, auf das institutionelle Eigentümer, Investmentmanager und Betreiber weltweit vertrauen. „KI kann die Immobilienbranche nur dann verändern, wenn sie die Immobilienbranche versteht“, sagte Dirk Wakeham, President...

-
Samsung se convierte en licenciatario y licenciante del consorcio Sisvel Wi-Fi Multimode
LUXEMBURGO--(BUSINESS WIRE)--Samsung Electronics se ha suscrito como licenciatario del consorcio Sisvel Wi-Fi Multimode y también se ha convertido en licenciante en el marco de este programa. La decisión del gigante mundial surcoreano de la investigación y el desarrollo, uno de los principales proveedores de teléfonos inteligentes del mundo y referente en muchas otras categorías de productos electrónicos, confirma que el consorcio Sisvel Wi-Fi Multimode es un proveedor de soluciones reconocido...

-
Samenvatting: Samsung wordt een licentiehouder en licentiegever van de Sisvel Wi-Fi Multimode-pool
LUXEMBURG--(BUSINESS WIRE)--Samsung Electronics heeft zich geregistreerd als licentiehouder van de Sisvel Wi-Fi Multimode-pool en is ook licentiegever onder het programma geworden. De beslissing van het Zuid-Koreaanse bedrijf - een internationale R&D-grootmacht en een van de belangrijkste leveranciers van smartphones ter wereld, evenals een leider in vele andere categorieën elektronicaproducten - bevestigt niet alleen dat de Sisvel Wi-Fi Multimode-pool een erkende leverancier van oplossinge...

-
First Trust Global Funds PLC UK Regulatory Announcement: Net Asset Value(s)
LONDON--(BUSINESS WIRE)-- Funds Date TIDM ISIN Code Shares in Issue Currency Net Asset Value NAV/per Share First Trust Vest Nasdaq-100 Moderate Buffer UCITS ETF - December 14.07.2026 QDEC.LN IE000GAKWFA7 550,002.00 USD 13,400,905.57 24.365 ...