

Newsroom
Sorted by: Latest
-
Estithmar Holding crée « Estithmar Capital » pour la gestion d'investissements financiers
DOHA, Qatar--(BUSINESS WIRE)--Estithmar Holding Q.P.S.C. a annoncé aujourd'hui la création de son cinquième groupe, « Estithmar Capital », une étape stratégique visant à consolider son expansion et à diversifier ses secteurs d'activité. Estithmar Capital se spécialisera dans la gestion d'investissements financiers, le renforcement de la gouvernance institutionnelle et l'exploitation, dans le respect de cadres clairs en matière de conformité, de réglementation et de gestion des risques, reflétan...

-
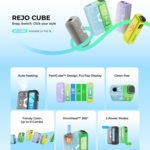
REJO、モジュール型デバイス「CUBE」を日本で世界初公開
TOKYO--(BUSINESS WIRE)--(ビジネスワイヤ) -- 加熱式(HNB)ソリューションの世界的な先駆的プロバイダーであるREJOはこのたび、同社の最新モジュール型HNBデバイス「REJO CUBE」を日本で世界初公開したと発表しました。 従来のHNBデバイスの設計概念から脱却した「REJO CUBE」は、トレンド志向のデザインとデュアルモード吸引体験を特徴とする新たなデバイスとして、2月16日より日本の主要Eコマース販売チャネルで発売されます。 今回の発売は、2025年7月に日本で導入された「REJO Mate Air」に続く同ブランドの最新の取り組みとなります。同デバイスは、コンパクトなデザイン、なめらかな吸い心地、そして「Puff Twice」機能により、日本の成人ユーザーから幅広い評価を得ました。 「REJO CUBE」は、ユーザー体験を研究開発の中核に据えるというREJOの継続的な取り組みを体現する製品です。モジュール設計によるキットの柔軟性、インタラクティブ機能による高いユーザーエンゲージメント、そして市場に流通するほぼすべての交換式スティックに対応するプ...
-
Massachusetts Financial Services Company UK Regulatory Announcement: Form 8.3
LONDON--(BUSINESS WIRE)-- FORM 8.3 PUBLIC OPENING POSITION DISCLOSURE/DEALING DISCLOSURE BY A PERSON WITH INTERESTS IN RELEVANT SECURITIES REPRESENTING 1% OR MORE Rule 8.3 of the Takeover Code (the “Code”) 1. KEY INFORMATION (a) Full name of discloser: Massachusetts Financial Services Company (b) Owner or controller of interests and short positions disclosed, if different from 1(a): The naming of nominee or vehicle companies is insufficient. For a trust, the trustee(s), settlor and beneficia...
-
Samson Rock Capital LLP UK Regulatory Announcement: Form 8.3
LONDON--(BUSINESS WIRE)-- FORM 8.3 PUBLIC OPENING POSITION DISCLOSURE/DEALING DISCLOSURE BY A PERSON WITH INTERESTS IN RELEVANT SECURITIES REPRESENTING 1% OR MORE Rule 8.3 of the Takeover Code (the “Code”) 1. KEY INFORMATION (a) Full name of discloser: SAMSON ROCK CAPITAL LLP (b) Owner or controller of interests and short positions disclosed, if different from 1(a): The naming of nominee or vehicle companies is insufficient. For a trust, the trustee(s), settlor and beneficiaries must be named....
-
Dynamic Map Platform complète sa couverture cartographique HD du Canada d'un océan à l'autre
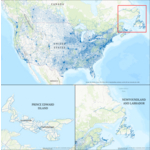
LIVONIA, Mich.--(BUSINESS WIRE)--Dynamic Map Platform (DMP) annonce l'achèvement de sa carte haute définition couvrant tout le territoire canadien. L'ajout de Terre-Neuve-et-Labrador et de l'Île-du-Prince-Édouard porte la couverture totale de DMP au Canada à 194 144 kilomètres dans les dix provinces, incluant les quatre principales classes de routes. Le kilométrage du Nord-Est canadien élargit la couverture nord-américaine existante de DMP à plus de 1 560 000 kilomètres. Les constructeurs autom...
-
Dynamic Map Platform Completes Coast-to-Coast Canadian HD Map Coverage
LIVONIA, Mich.--(BUSINESS WIRE)--Dynamic Map Platform (DMP) announces the completion of its coast-to-coast high-definition map in Canada. The addition of Newfoundland & Labrador and Prince Edward Island brings DMP's total Canadian coverage to 120,636 miles across all ten provinces including the top four road classes. The Northeast Canadian mileage expands DMP's existing North American coverage to more than 970,000 miles. Automotive OEMs rely on HD maps for safe deployment of ADAS/AV functio...

-
THG Partners With The Trade Desk to Pioneer a New Approach to Retail Media on the Open Internet
LONDON--(BUSINESS WIRE)--THG Ingenuity, the global digital commerce platform, part of The Hut Group, today announces a strategic partnership with global advertising technology leader, The Trade Desk. For the first time, media buyers (advertisers and agencies) can access THG’s segments from Cult Beauty and LOOKFANTASTIC via self-serve across the entire digital ecosystem on The Trade Desk’s media-buying Kokai platform. The new offering meets a growing market demand for increasingly personalised,...
-
First Trust Global Funds PLC UK Regulatory Announcement: Net Asset Value(s)
LONDON--(BUSINESS WIRE)-- Funds Date TIDM ISIN Code Shares in Issue Currency Net Asset Value NAV/per Share First Trust Vest U.S. Equity Buffer UCITS ETF - April 13.02.2026 FAPR.LN IE000WX2HZQ7 150,002.00 USD 3,675,483.63 24.503 ...
-
First Trust Global Funds PLC UK Regulatory Announcement: Net Asset Value(s)
LONDON--(BUSINESS WIRE)-- Funds Date TIDM ISIN Code Shares in Issue Currency Net Asset Value NAV/per Share First Trust Vest Nasdaq-100® Moderate Buffer UCITS ETF - March 13.02.2026 QMAR.LN IE0006S0EBF2 100,002.00 USD 2,278,430.84 22.784 ...
-
First Trust Global Funds PLC UK Regulatory Announcement: Net Asset Value(s)
LONDON--(BUSINESS WIRE)-- Funds Date TIDM ISIN Code Shares in Issue Currency Net Asset Value NAV/per Share First Trust Bloomberg Artificial Intelligence UCITS ETF 13.02.2026 FTAI IE000YIQZ0H6 150,002.00 USD 3,391,032.07 22.607 ...