

Newsroom
Sorted by: Latest
-
INVESTOR ALERT: Ultragenyx Pharmaceutical Inc. Investors with Substantial Losses Have Opportunity to Lead Class Action Lawsuit, Robbins Geller Rudman & Dowd LLP Announces
SAN DIEGO--(BUSINESS WIRE)--Ultragenyx allegedly misled investors about setrusumab’s potential Phase 3 study success in reducing fracture rates....
-
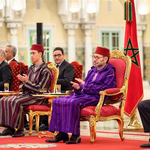
S.M. König Mohammed VI leitet Grundsteinlegung des Projekts für Fertigung von Flugzeugfahrwerken, das eine Investition von 280 Mio. Euro seitens der Safran Group in Marokko repräsentiert.
CASABLANCA-SETTAT, Marokko--(BUSINESS WIRE)--Seine Majestät König Mohammed VI - möge Gott ihm beistehen - in Begleitung von S.K.H. Kronprinz Moulay El Hassan stand am Freitag im Königlichen Palast in Casablanca an der Spitze der Präsentation und Grundsteinlegung des Projekts für den Bau einer Fahrwerksfertigungsanlage für Safran in Nouaceur. Dieses Projekt stellt Marokko als bevorzugten Standort und echten integrierten Industrieteilnehmer im Herzen der globalen Wirtschaft in den Blickpunkt. Die...

-
CORRECTING and REPLACING Pramata Launches Contract Intelligence Extension Compatible with Claude Cowork, Transforming How Enterprises Negotiate and Manage Contracts
SAN FRANCISCO--(BUSINESS WIRE)--Please replace the release dated February 5, 2026, with the following corrected version due to multiple revisions. The updated release reads: PRAMATA LAUNCHES CONTRACT INTELLIGENCE EXTENSION COMPATIBLE WITH CLAUDE COWORK, TRANSFORMING HOW ENTERPRISES NEGOTIATE AND MANAGE CONTRACTS The extension works alongside the Claude Cowork Legal plugin - currently available in research preview - to bring structured commercial relationship context into enterprise contract wor...
-
Riassunto: S.M. il Re Mohammed VI presiede la cerimonia di lancio del progetto riguardante uno stabilimento di produzione di carrelli di atterraggio – un investimento da 280 milioni di euro del Gruppo Safran in Marocco
CASABLANCA-SETTAT, Marocco--(BUSINESS WIRE)--Sua Maestà il Re Mohammed VI, che Dio L’assista, accompagnato da S.A.R. il Principe ereditario Moulay El Hassan, ha presieduto venerdì presso il Palazzo Reale di Casablanca la cerimonia di presentazione e lancio del progetto per la costruzione di uno stabilimento di produzione di carrelli di atterraggio per Safran a Nouaceur. Il progetto consolida il Marocco come destinazione di eccellenza e player industriale integrato al centro dell’economia global...

-
Samenvatting: Zijne Majesteit Koning Mohammed VI leidt de openingsceremonie van het project voor de bouw van een fabriek voor de productie van vliegtuiglandingsgestellen, een investering van 280 miljoen euro door de Safran-groep in Marokko
CASABLANCA-SETTAT, Marokko--(BUSINESS WIRE)--Zijne Majesteit Koning Mohammed VI, moge God hem bijstaan, heeft vrijdag in het Koninklijk Paleis in Casablanca, vergezeld door ZKH Kroonprins Moulay El Hassan, de presentatie en lanceringsceremonie voorgezeten van het project voor de bouw van een fabriek voor de productie van landingsgestellen voor Safran in Nouaceur. Het project versterkt Marokko als favoriete bestemming en een echte geïntegreerde industriële speler die centraal staat in de werelde...
-
LS Cable & System USA Announces $50 Million Expansion Investment in Tarboro, North Carolina
TARBORO, N.C.--(BUSINESS WIRE)--LS Cable & System USA, Inc. (“LSCUS” or the “company”), a US-based subsidiary of LS Cable & System Ltd. (“LS C&S”), today announced a $50 million investment to expand its manufacturing facility in Tarboro, North Carolina, underscoring the company’s commitment to onshoring advanced manufacturing to the United States, strengthening the supply chain, and serving as a key partner in the nation’s energy infrastructure. The expansion will add two additional...
-
World Liberty Forum Reaches Capacity as Global Leaders Prepare to Convene at Mar-a-Lago
PALM BEACH, Fla.--(BUSINESS WIRE)--World Liberty Financial ("WLFI”) today announced that the World Liberty Forum has reached capacity, with nearly 400 confirmed participants set to convene at Mar-a-Lago on February 18, 2026. The Forum will bring together an unprecedented assembly of leaders from global finance, technology, sports, media, and government for a day of high-level dialogue on the forces reshaping the global economy. “The response to the World Liberty Forum has been overwhelming, and...

-
HUBG INVESTOR ALERT: Kirby McInerney LLP Investigates Potential Claims Involving Hub Group, Inc.
NEW YORK--(BUSINESS WIRE)--The law firm of Kirby McInerney LLP continues its investigation on behalf of Hub Group, Inc. (“Hub Group” or the “Company”) (NASDAQ:HUBG) investors concerning the Company’s and/or members of its senior management’s possible violation of the federal securities laws and other unlawful business practices. [LEARN MORE ABOUT THE INVESTIGATION] What Happened? On January 5, 2026, Hub Group disclosed it had “identified an error that resulted in the understatement of purchased...
-
Liberty All-Star® Growth Fund, Inc. January 2026 Monthly Update
BOSTON--(BUSINESS WIRE)--Liberty All-Star® Growth Fund, Inc. January 2026 Monthly Update...
-
El sultán bin Ahmed visitó el Centro de Investigación y Desarrollo Huawei y el Shanghai Media Group (SMG) en China
SHANGHÁI--(BUSINESS WIRE)--Su alteza el jeque sultán bin Ahmed bin Sultan Al Qasimi, vicegobernador de Sharjah y presidente del Consejo de Medios de Comunicación de Sharjah, visitó el Centro de Investigación y Desarrollo Huawei y el Shanghai Media Group (SMG), en Shanghái, República Popular de China. Su Alteza recorrió el campus de Huawei, que se extiende sobre 2,2 millones de metros cuadrados y cuenta con más de 100 edificios y laboratorios, donde trabajan más de 30 000 empleados. Observó el p...
