

Newsroom
Sorted by: Latest
-
Entegris and JSR Corporation/Inpria Corporation Announce Non-Exclusive Cross-Licensing to EUV Lithography
BILLERICA, Mass. & TOKYO--(BUSINESS WIRE)--Entegris, Inc. (Nasdaq: ENTG), a global leader in advanced materials and purity solutions for the semiconductor industry, and JSR Corporation, a materials innovation leader and the parent company of Inpria Corporation, today announced entry into a non-exclusive cross-licensing agreement aimed at helping the semiconductor industry advance extreme ultraviolet (EUV) lithography for next generation chip manufacturing. “As the industry moves to smaller node...
-
FUTU HOLDINGS LIMITED INVESTOR ALERT: Kirby McInerney LLP Announces Investigation Into Potential Securities Fraud
NEW YORK--(BUSINESS WIRE)--The law firm of Kirby McInerney LLP is investigating potential claims against Futu Holdings Limited (“Futu” or the “Company”) (NASDAQ:FUTU). The investigation concerns whether the Company and/or members of its senior management may have violated federal securities laws or engaged in other unlawful business practices. [LEARN MORE ABOUT THE INVESTIGATION] What Happened? On May 22, 2026, Futu announced it had “received a Notice of Investigation and an Administrative Pen...
-
AISIN Selects Green Hills Software for Its AI-Powered Driver Monitoring Systems
YOKOHAMA, Japan--(BUSINESS WIRE)--Automotive Engineering Exposition -- Green Hills Software, the worldwide leader in embedded safety and security, today announces that AISIN Corporation (AISIN) has chosen Green Hills Software as the trusted software foundation for its next-generation Driver Monitoring System (DMS) with Alcohol Detection System (DADS). Today, AISIN is developing their systems with Green Hills products integrated with key collaborators, NXP® Semiconductors for the i.MX 9 series a...
-
Nutrien Prices Offering of an Aggregate of US$1.0 Billion of 5-Year and 10-Year Senior Notes
SASKATOON, Saskatchewan--(BUSINESS WIRE)--Nutrien Ltd. (TSX and NYSE: NTR) today announced the pricing of US$500 million aggregate principal amount of 4.850 percent senior notes due May 29, 2031 and US$500 million aggregate principal amount of 5.350 percent senior notes due May 29, 2036 (together, the “senior notes”). The offering is expected to close on or about May 29, 2026, subject to customary closing conditions. Nutrien intends to use the net proceeds from this offering to repay its US$500...
-
Quectel amplía su presencia en EMEA mediante un acuerdo de distribución con Future Electronics
BELGRADO, Serbia--(BUSINESS WIRE)--Quectel Wireless Solutions, proveedor global de soluciones IoT integrales, anunció hoy una ampliación de su acuerdo de distribución con Future Electronics para ofrecer su cartera completa de productos y servicios a clientes de toda la región EMEA. En virtud de este acuerdo, Future Electronics ofrecerá la cartera completa de productos IoT de Quectel a clientes de Europa, Oriente Medio y África, con especial atención a sus soluciones no celulares, que incluyen a...
-
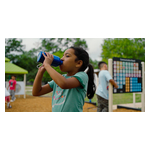
Uvalde CISD and Zurn Elkay Announce Donation for Cleaner, Healthier, Safer Drinking Water
UVALDE, Texas--(BUSINESS WIRE)--Zurn Elkay Water Solutions Corporation (NYSE: ZWS) and Uvalde Consolidated Independent School District (UCISD) today announced the donation of 36 Elkay Pro FiltrationTM filtered bottle filling stations, 19 Elkay® ezH2O® filtered bottle filling stations, 73 Elkay filtration conversion kits and five years of Elkay filters for each of the donated units, ensuring consistent delivery of cleaner, healthier, safer drinking water to students, faculty, staff and community...
-
Resumen: OpenRouter recauda 113 millones de dólares en una ronda serie B liderada por CapitalG tras alcanzar un volumen semanal de 25 billones de tokens
NUEVA YORK--(BUSINESS WIRE)--OpenRouter, una plataforma de modelos de inteligencia artificial, anunció hoy que se llevará a cabo una ronda de financiación serie B de 113 millones de dólares liderada por CapitalG, el fondo de inversión independiente de Alphabet, con la participación de inversores como NVentures (la división de capital riesgo de NVIDIA), ServiceNow Ventures, MongoDB Ventures, Snowflake Ventures y Databricks Ventures, además de inversores previos como Andreessen Horowitz y Menlo V...
-
OpenRouter lève 113 millions de dollars dans le cadre d’un tour de table de série B mené par CapitalG, alors que son volume hebdomadaire a explosé pour atteindre 25 000 milliards de jetons
NEW YORK--(BUSINESS WIRE)--OpenRouter, la plateforme d’échange de modèles IA, a annoncé aujourd’hui avoir levé 113 millions de dollars dans le cadre d’un tour de table de série B mené par CapitalG, le fonds de croissance indépendant d’Alphabet. Ce tour de table a également vu la participation d’investisseurs tels que NVentures (la branche de capital-risque de NVIDIA), ServiceNow Ventures, MongoDB Ventures, Snowflake Ventures et Databricks Ventures, ainsi que d’investisseurs existants, comme And...
-
Viking Takes Delivery of Newest Ocean Ship
LOS ANGELES--(BUSINESS WIRE)--Viking® (www.viking.com) (NYSE: VIK) today announced it has taken delivery of the Viking Mira®, the company’s newest ocean ship. The delivery ceremony took place this morning when the ship was presented at Fincantieri’s shipyard in Ancona, Italy. Like all Viking ocean ships, the Viking Mira is classified as a small ship, with 499 staterooms accommodating 998 guests. The Viking Mira joins the company’s growing fleet of award-winning ocean ships and will spend her in...
-
Riassunto: OpenRouter raccoglie 113 milioni di dollari in un round di finanziamento di Serie B guidato da CapitalG, mentre il volume settimanale esplode a 25 trilioni di token
NEW YORK--(BUSINESS WIRE)--OpenRouter, l'aggregatore di modelli di intelligenza artificiale, oggi ha annunciato un round di finanziamento di serie B da 113 milioni di dollari, condotto da CapitalG, il fondo di crescita indipendente di Alphabet, con la partecipazione di investitori tra cui NVentures (la divisione di capitale di rischio di NVIDIA), ServiceNow Ventures, MongoDB Ventures, Snowflake Ventures e Databricks Ventures, assieme a investitori esistenti, tra cui Andreessen Horowitz e Menlo...