

Newsroom
Sorted by: Latest
-
廣州設立全新辦公室:Kwiksure 快而保致力提升港車北上保險體驗
香港--(BUSINESS WIRE)--(美國商業資訊)-- 作為在香港深耕逾 25 年的專業保險代理品牌,Kwiksure 快而保一直為不同駕駛者提供多家保險公司間的中立比較服務,為客戶揀選最合適的一站式汽車保險方案。憑藉多年專注車保市場的經驗,Kwiksure 深知港車北上的駕駛者在兩地往返時,最擔心的往往不是保費,而是保障是否足夠、理賠流程是否清晰可靠,因此 Kwiksure 快而保特別於廣州設立全新辦公室,為北上港車車主提供更貼心及貼身的保險體驗。 配合等效先認政策 周全保障簡單易明 配合現行的「等效先認」政策,Kwiksure 快而保為客戶提供「商業第三者責任保險,簡稱商業險險及「機動車交通事故責任強制保險,簡稱「交強險」」方案,讓港車北上時能同時滿足內地相關法定要求,並將複雜的跨境保險要求變得清晰易明,避免出現保障空隙或重複投保的風險。 跨境理賠「翻譯員」 清晰程序減低風險 在理賠及程序方面,Kwiksure 快而保更致力擔當中港之間的翻譯員角色,不單是語言上的翻譯,亦包括制度、流程及文件要求的「翻譯員」。無論是意外報案、索償文件準備,抑或與兩地保險公司、相關部門溝通,K...
-
Drive Confidently: Cross-Border Car Insurance via Kwiksure
HONG KONG--(BUSINESS WIRE)--For expats and Hong Kong motorists eager to explore the Greater Bay Area by car, navigating the complexities of motor insurance can feel daunting. With evolving “Northbound Travel for Hong Kong Vehicles” policies, drivers face unfamiliar paperwork, regulations, and coverage requirements. That’s where Kwiksure, one of Hong Kong’s most trusted motor insurance brokers, steps in. With over 25 years of experience and a reputation for transparency, Kwiksure makes cross-bor...

-
メビオン・メディカル・システムズとタムアイン総合病院、ベトナムへの先進的な陽子線治療導入に向け提携
マサチューセッツ州リトルトン--(BUSINESS WIRE)--(ビジネスワイヤ) -- メビオン・メディカル・システムズは、ベトナムのタムアイン総合病院に「MEVION S250-FIT Proton Therapy System™」を導入するための正式な購入契約を締結しました。これは、ベトナム初の陽子線治療システムとなる予定です。今回の契約締結は、がん医療における大きな潮流を反映するものです。陽子線治療は導入しやすくなりつつあり、より多くの病院が、先進的な治療を必要とする患者のより身近な場所で提供できるようになっています。「MEVION S250-FIT™」および「MEVION S250i Proton Therapy System®」は、いずれも最近ベトナムで規制当局の承認を取得し、臨床導入に向けた重要な一歩となっています。 タムアイン総合病院における陽子線治療の導入は、東南アジアのがん医療における転換点となるものであり、メビオンのベトナム販売代理店であるTD Tech Companyが、その実現を支援しています。この国内での治療提供能力の確立により、ベトナムは先進的な陽子線...

-
Mevion Medical Systems與譚英綜合醫院合作,將先進的質子治療引進越南
麻薩諸塞州利特爾頓--(BUSINESS WIRE)--(美國商業資訊)-- Mevion Medical Systems已簽署一份最終採購協議,將向越南譚英綜合醫院(Tam Anh General Hospital)提供MEVION S250-FIT Proton Therapy System™(質子治療系統)。這將是越南的首台質子治療系統。此次簽約也反映出癌症治療領域的整體發展趨勢:質子治療的部署正變得更加切實可行,使更多醫院能夠將先進的治療手段帶到需要它的病患身邊。MEVION S250-FIT™和MEVION S250i Proton Therapy System®近期均已獲得越南的監管核准,代表向臨床應用邁出了重要一步。 在譚英綜合醫院引進質子治療代表東南亞癌症治療的轉折點,這一合作由Mevion在越南的經銷商TD Tech Company協助推進。透過建立這種本土化治療能力,越南加入了越來越多致力於擴大先進質子治療可及性的國家行列,確保越南病患在國內即可接受世界一流的治療。譚英綜合醫院的MEVION S250-FIT系統最早可望於2027年底運行,屆時譚英醫院位於越南最現代...
-
Mevion Medical Systems与谭英综合医院合作,将先进的质子治疗引入越南
马萨诸塞州利特尔顿--(BUSINESS WIRE)--(美国商业资讯)-- Mevion Medical Systems已签署一份最终采购协议,将向越南谭英综合医院(Tam Anh General Hospital)提供MEVION S250-FIT Proton Therapy System™(质子治疗系统)。这将是越南的首台质子治疗系统。此次签约反映了癌症治疗领域更广泛的转变:质子治疗的部署正变得更加切实可行,使更多医院能够将先进的治疗手段带到需要它的患者身边。MEVION S250-FIT™和MEVION S250i Proton Therapy System®近期均已获得越南的监管批准,标志着向临床应用迈出了重要一步。 在谭英综合医院引入质子治疗标志着东南亚癌症治疗的转折点,这一项目由Mevion在越南的经销商TD Tech Company推动。通过建立这种本土化治疗能力,越南加入了越来越多致力于扩大先进质子治疗可及性的国家行列,确保越南患者在国内即可接受世界级的治疗。谭英综合医院的MEVION S250-FIT系统预计最早将于2027年底投入运营,届时谭英医院位于越南最现代...

-
TIGR Investors Have Opportunity to Join UP Fintech Holding Limited Fraud Investigation with the Schall Law Firm
LOS ANGELES--(BUSINESS WIRE)--TIGR Investors Have Opportunity to Join UP Fintech Holding Limited Fraud Investigation with the Schall Law Firm...
-
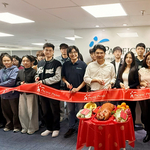
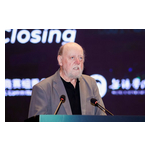
ASC26 Student Supercomputer Challenge Concluded
BEIJING--(BUSINESS WIRE)--ASC26 Student Supercomputer Challenge Concluded...
-
INTU Investors Have Opportunity to Join Intuit Inc. Fraud Investigation with the Schall Law Firm
LOS ANGELES--(BUSINESS WIRE)--INTU Investors Have Opportunity to Join Intuit Inc. Fraud Investigation with the Schall Law Firm...
-
ギガフォトン、九州事務所にトレーニング用レーザーを導入
栃木県小山市--(BUSINESS WIRE)--(ビジネスワイヤ) -- 半導体リソグラフィ用光源メーカーのギガフォトン株式会社(本社:栃木県小山市、代表取締役社長:榎波龍雄)は、2026年6月にギガフォトン九州事務所内にトレーニング用レーザーを導入し、お客様のサポート体制を強化すると発表しました。 近年のAI需要増加による半導体産業の成長により、今後更なる投資の増加が見込まれます。それに伴い、工場で稼働するギガフォトンのレーザー台数も増加することから、ギガフォトンではサービス強化を図るため、フィールドサービスエンジニア(FSE)の育成環境充実を目的に、九州事務所内にトレーニング用レーザーを導入し、2026年6月から運用を開始します。 今回、同事務所内にクリーンルームを開設し、最大3台のトレーニング用レーザーが設置可能となります。今回の導入により、FSE育成キャパシティをさらに拡大させることで、迅速なスキルアップを実現します。また、西日本地区に工場を有するお客様に向けたトレーニングを実施できる環境を整え、さらに連携を強化します。 ギガフォトン代表取締役社長兼CEOの榎波龍雄氏は、こ...
-
Training Lasers Installed at Gigaphoton Kyushu Office
OYAMA, Japan--(BUSINESS WIRE)--Gigaphoton announced the installation of training lasers at its Kyushu office, with operations starting in June 2026 to strengthen customer support....