

Newsroom
Sorted by: Latest
-
4th Digital Engineering Awards Celebrate Global Innovators, AI Trailblazers: Herald the Rise of Engineering Intelligence
BOSTON--(BUSINESS WIRE)--L&T Technology Services along with ISG and CNBC-TV18 hosted 4th Digital Engineering Awards to Celebrate Global Innovators....
-
Five9 Investigation Initiated: Kahn Swick & Foti, LLC Investigates the Officers and Directors of Five9, Inc. - FIVN
NEW YORK & NEW ORLEANS--(BUSINESS WIRE)--Former Attorney General of Louisiana, Charles C. Foti, Jr., Esq., a partner at the law firm of Kahn Swick & Foti, LLC (“KSF”), announces that KSF has commenced an investigation into Five9, Inc. (the “Company”) (NasdaqGM: FIVN). On August 8, 2024, post-market, the Company announced its 2Q 2024 financial results, disclosing cuts to its annual revenue guidance and that it was “no longer assuming” a dollar based retention rate inflection in the second ha...

-
Grindr Investigation Initiated: Kahn Swick & Foti, LLC Investigates the Officers and Directors of Grindr Inc. - GRND
NEW YORK & NEW ORLEANS--(BUSINESS WIRE)--The law firm of Kahn Swick & Foti, LLC (“KSF”) has commenced an investigation into Grindr Inc. (NYSE: GRND). KSF is investigating whether Grindr officers and/or directors, including its controlling stockholder, breached their fiduciary duties or otherwise violated state or federal laws. If you hold shares of Grindr Inc. (NYSE: GRND), we urge you to contact KSF to discuss your legal rights, without obligation or cost to you, by calling KSF toll-free a...

-
Mobileye Investigation Initiated: Kahn Swick & Foti, LLC Investigates the Officers and Directors of Mobileye Global Inc. - MBLY
NEW YORK & NEW ORLEANS--(BUSINESS WIRE)--The law firm of Kahn Swick & Foti, LLC (“KSF”) has commenced an investigation into Mobileye Global Inc. (NasdaqGS: MBLY). KSF is investigating potential breaches of fiduciary duty by Mobileye’s officers and directors in connection with Mobileye’s acquisition of Mentee Robotics, a company co-founded by officers of Mobileye. If you hold shares of Mobileye Global Inc. (NasdaqGS: MBLY), we urge you to contact KSF to discuss your legal rights, without obl...

-
CCOI Investor News: Rosen Law Firm Announces Investigation of Breaches of Fiduciary Duties by the Directors and Officers of Cogent Communications Holdings, Inc. – CCOI
NEW YORK--(BUSINESS WIRE)--Rosen Law Firm, a global investor rights law firm, announces an investigation of potential breaches of fiduciary duties by the directors and officers of Cogent Communications Holdings, Inc. (NASDAQ: CCOI). If you currently own shares of Cogent Communications stock, please visit the firm’s website at https://rosenlegal.com/submit-form/?case_id=56076 for more information. You may also contact Phillip Kim of Rosen Law Firm toll free at 866-767-3653 or via email at case@r...
-
YolTech Therapeutics Receives FDA Clearance to Initiate Phase 2/3 Study of In Vivo Gene-Editing Therapy YOLT-202 in Alpha-1 Antitrypsin Deficiency (AATD)
SHANGHAI--(BUSINESS WIRE)--YolTech Therapeutics, a late clinical-stage biotechnology company developing in vivo gene-editing therapies, today announced that the U.S. Food and Drug Administration (FDA) has approved the Investigational New Drug (IND) application for YOLT-202, the company’s investigational in vivo base-editing therapy for the treatment of Alpha-1 Antitrypsin Deficiency (AATD). The FDA approval enables the initiation of an open-label, single-dose expansion Phase 2/3 clinical study...
-
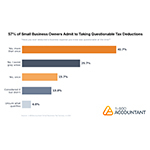
1-800Accountant Survey Finds: 57% of Small Business Owners Admit Taking Questionable Tax Deductions
NEW YORK--(BUSINESS WIRE)--A 1-800Accountant survey finds 57% of small business owners admit taking questionable tax deductions, highlighting confusion around common write-offs....
-
Dream Finders Homes named the Official Home Builder of the Tampa Bay Rays and Tampa Bay Rowdies
JACKSONVILLE, Fla.--(BUSINESS WIRE)--Today, the Tampa Bay Rays and Dream Finders Homes (NYSE: DFH) announced a new multi-year partnership that begins this season. Dream Finders Homes, the 2025 National Builder of the Year, will now serve as the Official Home Builder of the Tampa Bay Rays. This partnership will feature several marketing opportunities throughout the season designed to raise Dream Finders Homes’ profile and brand recognition in the Tampa Bay region. Inclusion at fan-facing events,...
-
Mattel Presents at 2026 UBS Global Consumer and Retail Conference to Discuss Strategy and Outlook
EL SEGUNDO, Calif.--(BUSINESS WIRE)--Mattel, Inc. (NASDAQ: MAT), a leading global play and family entertainment company and owner of one of the most iconic brand portfolios in the world, participated on Thursday, March 12, 2026 in a keynote presentation at the UBS Global Consumer and Retail Conference. Chairman and Chief Executive Officer Ynon Kreiz conducted broadcast interviews with Bloomberg and CNBC adjacent to the conference. Management discussed the company’s outlook for this year and bey...
-
INVESTOR DEADLINE: Trip.com Group Limited Investors with Substantial Losses Have Opportunity to Lead Class Action Lawsuit, Robbins Geller Rudman & Dowd LLP Announces
SAN DIEGO--(BUSINESS WIRE)--The case alleges that defendants recklessly understated the regulatory risk facing Trip.com as a result of its monopolistic business activities....