

Newsroom
Sorted by: Latest
-
Prosus Profitability Jumps 84%, Free Cash Flow up US$2BN in 3 Years
AMSTERDAM--(BUSINESS WIRE)--Prosus N.V. ("Prosus") (Euronext Amsterdam: PRX; JSE: PRX) (Prosus): FY26 was a year of delivery: strong results, disciplined capital allocation, and accelerating AI innovation. Prosus delivered across its AI-powered Lifestyle Ecosystem of delivery, finance and experiences, with all regional ecosystems profitable. Our businesses are increasingly interconnected, driving higher engagement, stronger cross-selling and accelerating network effects. AI is embedded at every...
-
Naspers Profitability Jumps 84%, Free Cash Flow up US$2bn in 3 Years
CAPE TOWN, South Africa--(BUSINESS WIRE)--Naspers Limited (Naspers) (JSE: NPN): FY26 was a year of delivery: strong results, disciplined capital allocation, and accelerating AI innovation. Naspers delivered across its AI-powered Lifestyle Ecosystem of delivery, finance and experiences, with all regional ecosystems profitable. Our businesses are increasingly interconnected, driving higher engagement, stronger cross-selling and accelerating network effects. AI is embedded at every layer, from age...
-
オムディア(Omdia)、韓国制作コンテンツがNetflixで米国以外のコンテンツとして最多視聴を記録と発表
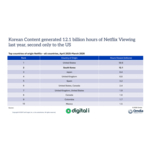
ロンドン--(BUSINESS WIRE)--(ビジネスワイヤ) -- 今週、釜山で開催された「International Streaming Summit(OTT・FAST)2026」で発表されたオムディアとDigital iによる最新分析によると、2025年4月から2026年3月までの1年間において、韓国コンテンツはNetflix上で世界累計121億時間の視聴時間を記録し、米国を除くコンテンツ制作国の中で最も視聴されたコンテンツとなった。 主要な調査結果 分析によると、韓国コンテンツの視聴時間は日本コンテンツを44%上回り、英国コンテンツのほぼ2倍に達した。これは、グローバルなストリーミング視聴者に対する韓国の影響力が拡大していることを示している。 『イカゲーム』(Squid Game)『大洪水』(The Great Flood)『おつかれさま』(When Life Gives You Tangerines)といった世界的ヒット作品が、日本、英国、スペインなどの主要コンテンツ輸出市場を上回る韓国コンテンツの好調な実績に貢献した。 業界専門家の見解 オムディア(Omdia)のメディ...
-
Omdia:韓國製作的影視作品是Netflix除美國以外觀看次數最多的內容
倫敦--(BUSINESS WIRE)--(美國商業資訊)-- Omdia和Digital i在本週於釜山舉行的2026年國際流媒體高峰會(OTT·FAST)上發布的一項最新分析稱,2025年4月至2026年3月期間,韓國內容在全球Netflix上的觀看時長達121億小時,成為美國以外觀看量最高的內容來源國。 分析發現,韓國內容的觀看時長比日本內容高出44%,幾乎是英國內容的兩倍,凸顯了韓國在全球串流媒體觀眾中與日俱增的影響力。 《魷魚遊戲》、《巨洪》及《苦盡柑來遇見你》等全球熱門作品推動韓國內容超越了包括日本、英國和西班牙在內的其他主要內容出口市場。 「韓國已成為美國以外全球熱門內容的主要來源國。」Omdia媒體與娛樂主管Maria Rua Aguete表示,「Netflix一年內121億小時的觀看時長充分展現了國際市場對韓國作品的巨大需求,也凸顯了韓國在全球內容產業中與日俱增的重要性。」 韓國的成功反映了全球娛樂產業的更廣泛轉變,即觀眾越來越傾向於接受超越語言和地域限制的故事。 「串流媒體時代改變了全球娛樂的規則。精彩的故事如今可以瞬間跨越國界,而韓國正是透過將優秀的敘事、精良的製...

-
Six in Ten UK Consumers Would Stop Using an AI Shopping Agent After One Mistake, ACI Survey Finds
LONDON--(BUSINESS WIRE)--New research from ACI Worldwide (NASDAQ: ACIW), an original innovator in global payments technology, reveals a significant trust gap between artificial intelligence and human decision-makers, highlighting a key barrier to the widespread adoption of AI shopping agents. A YouGov survey of more than 2,000 UK adults, conducted on behalf of ACI Worldwide, found that just 19% of consumers trust AI assistants to follow rules to set up make every day purchasing decisions, compa...
-
Banyan Software Welcomes tec4U-Solutions
MUNICH--(BUSINESS WIRE)--Banyan Software announced the acquisition of Saarbrücken-based tec4U-Solutions....
-
Beerenberg obtient gain de cause dans le litige en matière de brevets qui l’opposait à Aspen Aerogels
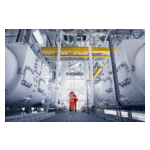
SÉOUL, Corée du Sud--(BUSINESS WIRE)--Le Tribunal coréen des brevets a invalidé trois brevets d’Aspen Aerogels relatifs à un matériau aérogel hydrophobe amélioré. Cette décision confirme la conclusion de la Commission d’appel et de jugement en matière de propriété intellectuelle (IPTAB) selon laquelle ces brevets ne remplissaient pas les conditions requises pour être brevetables. Beerenberg, société spécialisée dans les produits d’isolation haut de gamme, se félicite de la décision du tribunal....

-
Beerenberg prevale nella causa sui brevetti contro Aspen Aerogels
SEUL, Corea del Sud--(BUSINESS WIRE)--Il Tribunale coreano dei brevetti ha annullato tre dei brevetti di Aspen Aerogels relativi al materiale aerogel idrofobico migliorato. La sentenza conferma la conclusione della Commissione per i ricorsi in materia di proprietà intellettuale (IPTAB) che i brevetti non soddisfacevano i requisiti necessari per la brevettabilità. Beerenberg, azienda specializzata in prodotti di isolamento di alta gamma, accoglie con favore la decisione del tribunale. “Siamo lie...

-
Beerenberg gewinnt Patentstreit gegen Aspen Aerogels
SEOUL, Südkorea--(BUSINESS WIRE)--Das koreanische Patentgericht hat drei Patente von Aspen Aerogels im Zusammenhang mit einem verbesserten hydrophoben Aerogel-Material für ungültig erklärt. Das Urteil bestätigt die Feststellung der Intellectual Property Trial and Appeal Board (IPTAB), dass die Patente die erforderlichen Voraussetzungen für die Patentierbarkeit nicht erfüllten. Beerenberg, ein Spezialist für hochwertige Isolierprodukte, begrüßt die Entscheidung des Gerichts. „Wir freuen uns, das...
-
Beerenberg se impone en un caso de patentes contra Aspen Aerogels
SEÚL, Corea del Sur--(BUSINESS WIRE)--El Tribunal de Patentes de Corea ha invalidado tres de las patentes de Aspen Aerogels relacionadas con material de aerogel hidrofóbico mejorado. El fallo confirma la conclusión de la Junta de Juicios y Apelaciones de Propiedad Intelectual (IPTAB) de que las patentes no satisfacen los requisitos necesarios de patentablidad. Beerenberg, que se especializa en productos de aislamiento de alta gama, celebra la decisión del tribunal. “Nos complace que ya se haya...
