Newsroom
Sorted by: Latest
-
Investor Notice: Robbins LLP Informs Investors of the Stellantis N.V. Class Action
SAN DIEGO--(BUSINESS WIRE)--Robbins LLP informs stockholders that a class action was filed on behalf of all investors who purchased or otherwise acquired Stellantis N.V. (NYSE: STLA) securities between February 26, 2025 and February 5, 2026. Stellantis is a global automobile designer, engineer, manufacturer, and distributor.For more information, submit a form, email attorney Aaron Dumas, Jr., or give us a call at (800) 350-6003.The Allegations: Robbins LLP is Investigating Allegations that Stell...

-
Investor Notice: Robbins LLP Informs Investors of Upstart Holdings, Inc. Class Action
SAN DIEGO--(BUSINESS WIRE)--Robbins LLP informs stockholders that a class action was filed on behalf of all investors who purchased or otherwise acquired Upstart Holdings, Inc. (NASDAQ: UPST) securities between May 14, 2025 and November 4, 2025. Upstart, together with its subsidiaries, operates a cloud-based artificial intelligence (“AI”) lending platform in the U.S.For more information, submit a form, email attorney Aaron Dumas, Jr., or give us a call at (800) 350-6003.The Allegations: Robbins...

-
欧州、アジア、米州におけるロボット密度の急伸長
フランクフルト--(BUSINESS WIRE)--(ビジネスワイヤ) -- 生産性向上の鍵を握るツールとして、世界中の産業界で工場ロボットの導入が重点的に進められている。世界各国が競って自動化を進めるなか、2024年、西欧諸国は製造業従業員1万人当たり267台という過去最高の台数を記録し、北米の204台、アジアの131台を上回った(出所:国際ロボット連盟(IFR)発表の報告書『ワールドロボティックス2025』)。 「ロボット密度の指標は、その国で使用されているロボットの総数と、労働人口で測定されるその国の経済規模を関連付けることによって、比較のための統一基準を提供します」と、国際ロボット連盟の伊藤孝幸会長は言う。 地域別のロボット密度 西欧諸国のロボット密度は前年比で3%増となった。ドイツ、スイス、オランダ、オーストリア、イタリア、ベルギー/ルクセンブルグ、フランス、スペインの8カ国が世界トップ20に入っている。欧州連合(EU-27)全体では、従業員1万人当たりのロボット密度は231台となり、世界平均132台を上回る。 北米のロボット密度は4%増となった。従業員1万人当たり307台...
-
COTY INVESTOR REMINDER: Coty Inc. Investors Have Until May 22, 2026 To Seek Lead Plaintiff Role
NEW YORK--(BUSINESS WIRE)--If you have suffered a loss on your Coty Inc. (“Coty” or the “Company”) (NYSE:COTY) investment, contact Lauren Molinaro of Kirby McInerney LLP by email at investigations@kmllp.com, or fill out the contact form below to discuss your rights or interests in the securities fraud class action lawsuit at no cost.Investors have until May 22, 2026 to ask the Court to appoint them as lead plaintiff. Courts do not consider applications filed after this deadline. The lead plainti...
-
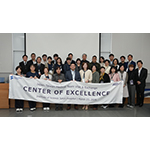
日台医療従事者29名が参加、ASPJapanが東京科学大学病院でCOE交流プログラムを開催
東京--(BUSINESS WIRE)--(ビジネスワイヤ) -- ASP Japan合同会社(以下、ASP Japan)は、2026年3月23日、東京科学大学病院を開催地として、台湾および日本の医療従事者を対象とした「Center of Excellence(COE)交流プログラム」を主催しました。 本プログラムには、日本・台湾から計29名の医療従事者が参加し、感染管理および医療機器再処理をテーマに、教育目的の製品講習、病院内での実地講習、ならびに参加者同士の意見交換を行いました。 開催の背景 医療の高度化が進む中、感染管理および医療機器再処理の適正な運用は、医療安全を支える重要な基盤のひとつです。とりわけ中央材料室(CSSD)業務においては、機器や手順に関する知識だけでなく、実際の医療現場に即した運用や組織的な対応を学ぶ機会が求められています。今回のプログラムは、日本の大学病院における実務経験の共有に加え、台湾と日本の医療従事者が同じ現場を見ながら学び合うことで、感染管理および再処理業務に関する相互理解を深めることを目的に企画されました。 当日の内容 当日は、講義形式によるセッシ...
-
Vistance Networks Board Approves Special Distribution
RICHARDSON, Texas--(BUSINESS WIRE)--Vistance Networks (NASDAQ: VISN) (“Vistance” or the “Company”), a global provider of intelligent network solutions, today announced its Board of Directors (the “Board”) declared a special cash distribution of $10.00 per share, payable on April 27, 2026 to holders of record of its common stock as of the close of business on April 17, 2026. The Company will fund the payment of the distribution with cash on hand including cash proceeds received in connection wit...
-
Drift Protocol Cryptocurrency Hack Class Action Lawsuit Investigation; Drift Investors Urged to Contact Award-Winning Financial Fraud Recovery Firm, Gibbs Mura, A Law Group
OAKLAND, Calif.--(BUSINESS WIRE)--Gibbs Mura, A Law Group has opened an investigation into the Drift Protocol exploit on April 1, 2026, in which hackers allegedly drained an estimated $280-285 million from investor trading, lending and vault deposits, and then moved the stolen assets through Circle’s Cross-Chain Transfer Protocol (CCTP) over the course of several hours. According to news reports, Circle Internet Financial made no intervention to freeze the funds, despite having aggressively froz...

-
Consertus Acquires Airosmith to Expand Telecommunications and Renewable Infrastructure Capabilities
MIAMI--(BUSINESS WIRE)--Consertus, Inc., a portfolio company of RTC Partners, today announced that Airosmith, Inc. dba Airosmith Development, a Saratoga Springs, New York–based provider of pre-construction solutions for wireless, fiber, and renewable energy infrastructure, has joined the Consertus family. The acquisition adds 105 infrastructure development professionals with deep expertise in wireless, fiber, engineering and utility programs, significantly expanding Consertus’ telecommunication...
-
New Clinical Data on Fish-Skin Grafts to Headline Kerecis Presence at SAWC Spring
CHARLOTTE, N.C.--(BUSINESS WIRE)--Kerecis will present data at SAWC Spring 2026 showing fish-skin grafts are superior to standard care for treating severe Stage 3 and 4 pressure ulcers...
-
威尔逊律师事务所迎来合伙人周仲荍(Jocelyn Chow)提升香港办公室国家安全与反垄断业务
加利福尼亚州帕拉奥图市--(BUSINESS WIRE)--(美國商業資訊)-- 全球领先的科技、生命科学及高成长企业法律服务机构威尔逊・桑西尼・古奇・罗沙迪律师事务所(Wilson Sonsini Goodrich & Rosati,以下简称威尔逊律师事务所)今日宣布,周仲荍(Jocelyn Chow)律师作为合伙人加入本所香港办公室,专注于国家安全与反垄断业务。周律师在国家安全、反垄断及监管执法领域的全面执业经验,将进一步增强律所在亚太地区的业务实力。 本所管理合伙人Doug Clark表示:“周律师在国家安全与反垄断领域具备深厚专业知识,同时对大中华区市场有着深刻理解,将有力提升我们为全球客户应对不断变化的复杂监管环境的服务能力。随着我们进一步拓展在亚太地区的成熟布局,很高兴周律师能加入本所这支优秀的律师团队。” 周律师的执业领域涵盖各类反垄断与贸易法律事务。她长期为跨国企业提供合规咨询、内部调查、政府调查及执法应对等法律服务,同时就涉及反垄断、经济与贸易制裁、出口管制、进口管制及外商投资管制等事项的受监管交易提供专业意见。其服务客户遍及多个行业,包括国防、生命科学、高端...