Newsroom
Sorted by: Latest
-
FIDO联盟公布Authenticate APAC 2026会议议程
新加坡--(BUSINESS WIRE)--(美国商业资讯)-- FIDO联盟今日公布Authenticate APAC 2026会议议程,本次大会汇聚全球行业领导者,共同推动安全、便捷和可信的身份认证技术发展。此次亚太区首届活动标志着Authenticate首次在该地区举办,此前已在美国成功举办了七届Authenticate活动,并举行了两届区域性FIDO亚太峰会。 Authenticate APAC 2026将于2026年6月2日至3日在新加坡君悦酒店举行,由Google、Visa和Yubico担任首席赞助商。 本次会议议程专为企业领导者、安全专业人士和产品创新者设计,将技术深度与真实世界的部署洞察和对数字身份与可信交互发展趋势的前瞻性观点相结合。 Authenticate APAC 2026提供独特的机会,使参会者能够直接聆听大规模部署现代身份认证技术的企业分享,获取关于实施通行密钥的实用洞察,探讨数字凭证、AI和智能体驱动能力的发展现状,以及推动普及所需的关键要素。它还清晰呈现不断演进的标准、法规和新应用场景如何塑造亚太乃至全球范围内可信身份相关交互的未来。 议程要点包括: 身...
-
FIDO聯盟公布Authenticate APAC 2026會議議程
新加坡--(BUSINESS WIRE)--(美國商業資訊)-- FIDO聯盟今日公布Authenticate APAC 2026會議議程,本次大會匯聚全球產業領導者,共同推動安全、便捷和可信的身分認證技術發展。此次亞太區首屆活動是Authenticate首次在該地區舉辦,此前已在美國成功舉辦了七屆Authenticate活動,並舉行了兩屆區域性FIDO亞太高峰會。 Authenticate APAC 2026將於2026年6月2日至3日在新加坡君悅酒店舉行,由Google、Visa和Yubico擔任首席贊助商。 本次會議議程專為企業領導者、安全專業人士和產品創新者設計,將技術深度與真實世界的部署洞察和對數位身分與可信互動發展趨勢的前瞻性觀點相結合。 Authenticate APAC 2026提供獨特的機會,使參會者能夠直接聆聽大規模部署現代身分認證技術的企業分享,取得關於實施通行金鑰的實用洞察,探討數位憑證、AI和代理驅動能力的發展現狀,以及推動普及所需的關鍵要素。它還清晰呈現不斷演進的標準、法規和新應用場景如何塑造亞太乃至全球可信身分相關互動的未來。 議程要點包括: 身分認證標準...

-
FIDOアライアンス、Authenticate APAC 2026のアジェンダを発表
シンガポール--(BUSINESS WIRE)--(ビジネスワイヤ) -- FIDOアライアンスは、認証とアイデンティティのための安全でシンプルかつ信頼性の高いテクノロジーを推進するグローバルリーダーが一堂に会するカンファレンスであるAuthenticate APAC 2026のアジェンダを発表しました。今回初めてAPACで開催されるこのイベントは、米国で7年間成功を収めてきたAuthenticateイベントと、2年間開催されてきたFIDO APACサミットの実績をもとに、Authenticateがこの地域に登場する初めての機会となります。 Authenticate APAC 2026は、2026年6月2日~3日にグランド ハイアット シンガポールで開催され、グーグル、ビザ、ユビコがシグネチャースポンサーとして支援を行います。 ビジネスリーダー、セキュリティ分野の専門家、製品イノベーター向けとして開催される本イベントは、技術的な深みと実際の導入事例に関するインサイト、そしてデジタルアイデンティティと信頼できるインタラクションの進化に関する将来の展望を融合させたものです。 Authen...

-
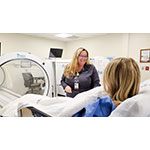
RestorixHealth Celebrates Hyperbaric Awareness Month
METAIRIE, La.--(BUSINESS WIRE)--RestorixHealth, the nation’s premier partner for wound care and hyperbaric center management, is pleased to join the broader hyperbaric medicine community in recognizing May as Hyperbaric Awareness Month. Launched in 2021 by the Undersea & Hyperbaric Medical Society, the primary source of scientific information for hyperbaric medicine physiology worldwide, and Hyperbaric Awareness USA™, Hyperbaric Awareness Month aims to elevate awareness of hyperbaric oxygen...
-
Barilla promove jantar surpresa de reencontro da família da Fórmula 1® durante o fim de semana da corrida em Miami
MIAMI--(BUSINESS WIRE)--Um convite especial, uma mesa e um prato de massa compartilhados por pessoas que muitas vezes estão separadas. Foi tudo o que a Barilla precisou para levar o espírito de união a Miami durante o dia de abertura do FORMULA 1® CRYPTO.COM MIAMI GRAND PRIX 2026. A Barilla, Parceira Oficial de Massas da Fórmula 1®, recebeu os membros da equipe e suas famílias no Torno Subito Miami, restaurante do chef Massimo Bottura, detentor de três estrelas Michelin, com a cozinha comandada...

-
Interactive Brokers Group Reports Brokerage Metrics and Other Financial Information for April 2026, includes Reg.-NMS Execution Statistics
GREENWICH, Conn.--(BUSINESS WIRE)--Interactive Brokers Group, Inc. (Nasdaq: IBKR) an automated global electronic broker, today reported its Electronic Brokerage monthly performance metrics for April. Brokerage highlights for the month included: 4.241 million Daily Average Revenue Trades (DARTs)1, 11% higher than prior year and 2% lower than prior month. Ending client equity of $870.9 billion, 48% higher than prior year and 10% higher than prior month. Ending client margin loan balances of $91.3...

-
Barilla organise un dîner surprise réunissant les familles des pilotes de Formule 1® lors du week-end de course à Miami
MIAMI--(BUSINESS WIRE)--Une invitation spéciale, une table et un plat de pâtes partagé entre des personnes qui sont souvent séparées : voilà tout ce qu’il a fallu à Barilla pour instaurer une ambiance conviviale à Miami, lors de la journée d’ouverture du Grand Prix automobile de Miami 2026 (FORMULA 1® CRYPTO.COM MIAMI GRAND PRIX 2026). Barilla, le partenaire officiel de la Formule 1® pour les pâtes, a accueilli les membres de l’écurie et leurs familles au Torno Subito Miami, le restaurant du ch...
-
Samenvatting: Barilla houdt een verrassingsdiner als gezinsreunie tijdens het Formula 1® raceweekend in Miami
MIAMI--(BUSINESS WIRE)--Een speciale uitnodiging, een tafel en een pastagerecht gedeeld door mensen die vaak van elkaar gescheiden zijn. Dit was voor Barilla voldoende aanleiding om in Miami een geest van samenhorigheid te brengen tijdens de openingsdag van de FORMULA 1® CRYPTO.COM MIAMI GRAND PRIX 2026. Barilla, de Officiële Pastapartner van Formula 1®, verwelkomde teamleden en hun gezinnen in Torno Subito Miami, het restaurant van chef Massimo Bottura bekroond met drie Michelin-sterren, waar...

-
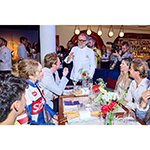
Barilla Hosts Surprise Formula 1® Family Reunion Dinner During Miami Race Weekend
MIAMI--(BUSINESS WIRE)--A special invitation, a table, and a plate of pasta shared by people who are often apart. That’s all it took for Barilla to bring the spirit of togetherness to Miami during the opening day of the FORMULA 1® CRYPTO.COM MIAMI GRAND PRIX 2026. Barilla, the Official Pasta Partner of Formula 1®, welcomed team members and their families to Torno Subito Miami, the restaurant by three-Michelin-starred Chef Massimo Bottura, with the kitchen led by Chef Bernardo Paladini, for an e...

-
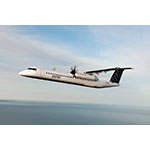
Porter Airlines relie Ottawa à Windsor et Sudbury par l’entremise d’un nouveau service quotidien
OTTAWA, Ontario--(BUSINESS WIRE)--Porter Airlines élargit aujourd’hui son offre au départ d’Ottawa (YOW) avec le lancement d’un service quotidien vers Windsor (YQG) et Sudbury (YSB), ajoutant ainsi d’autres options de voyage en Ontario et ailleurs. Ces itinéraires sans escale ne sont offerts qu’avec Porter. La présence croissante de la compagnie aérienne à YOW signifie que les voyageurs peuvent facilement profiter d’un large éventail de destinations depuis la capitale nationale, y compris Toron...