Newsroom
Sorted by: Latest
-
Ducon Announces Advanced Solutions to Mitigate Air Pollution from Missile Interceptions
NEW YORK--(BUSINESS WIRE)--Ducon Technologies (“Ducon”), a global leader in high-efficiency air pollution control and infrastructure related technologies, today announced solutions for the escalating environmental and public health crisis caused by high-altitude missile interceptions in the ongoing conflict in Iran. When an air defense system successfully intercepts a missile, the immediate reaction is one of relief. A fireball in the sky represents a catastrophe averted on the ground. However,...
-
RYAM Statement on Localized Fire at Jesup Facility
JACKSONVILLE, Fla.--(BUSINESS WIRE)--Rayonier Advanced Materials Inc. (NYSE: RYAM) confirmed that an isolated fire occurred at approximately 10:00 p.m. on April 4 in the digester area of its Jesup, Georgia facility during its scheduled annual maintenance outage. The fire was quickly contained and extinguished by the Company’s on-site team with assistance from local first responders. There were no injuries and no off-site impacts. The Company has initiated standard follow-up actions, including a...
-
Faraday Future Founder and Co-CEO YT Jia Shares Weekly Investor Update: FF to Establish the First Scaled EAI Education System in the United States With Deployment of Its EAI Robotics Products and Technology
LOS ANGELES--(BUSINESS WIRE)--Faraday Future Intelligent Electric Inc. (NASDAQ: FFAI) (“Faraday Future”, “FF” or the “Company”), a California-based global Embodied AI (EAI) ecosystem company, today shared a weekly business update from YT Jia, Founder and Global Co-CEO of FF. This week’s update will be in the form of a Q&A session with YT. “Q1: YT, you mentioned that, in your opinion, the most important highlight of this annual financial report is that the Company’s net equity turned from ne...

-
Huawei、LG Electronics、および Nokia がシズベルの新しい POS プールの創設ライセンサーに
ルクセンブルク--(BUSINESS WIRE)--(ビジネスワイヤ) -- シズベルは本日、2G から 5G 技術を対象とする新たな POS(販売時点情報管理)特許プールを発表し、その創設ライセンサーとして、世界クラスのイノベータ 3 社が参画していることを明らかにしました。 これら 3 社、Huawei、LG Electronics、Nokia は、セルラー通信対応の POS デバイスに関する標準必須特許(SEP)を、本プログラムを通じて利用できるよう提供し、ユビキタス化がますます進む技術へのアクセスを簡素化します。 本特許プールでは、ライセンサーの早期参加を促進するインセンティブを 5 月中旬までご提供しています。現在シズベルと協議中でない他のセルラー特許権者の皆様も、ぜひ参加をご検討のうえ、当社にお問い合わせください。 ハンドヘルド型カード決済端末からタブレット型レジスターまで、POS デバイスは顧客の支払い処理を大きく変革してきました。さらに近年では、在庫管理、リアルタイム追跡、詳細分析、自動再発注などの高度な機能も備えるようになっています。 標準化されたセルラー技術は、顧...
-
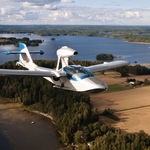
„Sensofusion“ pristato „Sensofusion Aviation“ – kovos su bepiločiais orlaiviais sistemas, skirtas naudoti ore
HELSINKIS--(BUSINESS WIRE)--Sparčiai auganti Suomijos gynybos technologijų įmonė „Sensofusion“ įsigijo Suomijos orlaivių gamintoją „Atol Aviation“. Įsigijusi šią gamintoją „Sensofusion“ grupė įgyja orlaivių ir bepiločių orlaivių gamybos patirties bei pajėgumų ir taip dar labiau išsiplečia įmonės galimybės vykdyti žvalgybą naudojant „oras–žemė“ jutiklius. „Atol Aviation“ vykdo veiklą Hali, Suomijoje, buvusioje Suomijos karinių oro pajėgų bazėje, kurioje įmonė sukūrė „Atol Aurora“ amfibinį orlaiv...

-
Sensofusion tutvustab Sensofusion Aviationit, mis viib droonitõrjesüsteemid taevasse
HELSINKI--(BUSINESS WIRE)--Kiiresti kasvav Soome kaitsetehnoloogiaettevõte Sensofusion omandas Soome lennukitootja Atol Aviation. Omandamine toob Sensofusioni kontserni lennukite ja mehitamata õhusõidukite tootmise alase oskusteabe ning tootmisvõimsused, laiendades veelgi ettevõtte suutlikkust teostada õhk-maa sensoripõhist luuret. Atol Aviation tegutseb Soomes Hallis endises Soome õhujõudude baasis, kus ettevõte on välja töötanud amfiiblennuki Atol Aurora ning ametkondlikuks ja kaitseotstarbel...
-
Taber, AB Named Winner of Kraft Hockeyville 2026
TORONTO--(BUSINESS WIRE)--Kraft Heinz, in partnership with the National Hockey League (NHL®) and the National Hockey League Players' Association (NHLPA), is pleased to announce that Taber, Alberta has been named the winner of Kraft Hockeyville 2026. Taber, Alberta will receive $250,000 for rink upgrades, plus the opportunity to host an NHL® Pre-Season game for their community in the fall of 2027. The runner-up, Tumbler Ridge, British Columbia, will be awarded $100,000 for rink upgrades—four tim...

-
Taber (Alberta) couronnée la grande gagnante de Kraft Hockeyville 2026
TORONTO--(BUSINESS WIRE)--Kraft Heinz, en partenariat avec la Ligue nationale de hockey (LNH®) et l’Association des joueurs de la Ligue nationale de hockey (AJLNH), est heureuse d’annoncer que Taber, en Alberta, a été nommée la grande gagnante de Kraft Hockeyville 2026. Taber, en Alberta, recevra 250 000 $ pour des améliorations à son aréna, en plus de la possibilité d’accueillir un match de présaison de la LNH® dans sa communauté à l’automne 2027. La municipalité finaliste, Tumbler Ridge, en C...

-
INSERTING and REPLACING Register for Galaxy Unpacked 2026 for a Chance to Win BTS Concert Tickets
TORONTO--(BUSINESS WIRE)--Samsung Electronics is counting down to Galaxy Unpacked 2026 and Canadians have an exciting reason to tune in....

-
Snowflake Inc. Class Action Reminder - Robbins LLP Encourages SNOW Stockholders to Contact the Firm for Information About Their Rights
SAN DIEGO--(BUSINESS WIRE)--Robbins LLP reminds stockholders that a class action was filed on behalf of all investors who purchased or otherwise acquired Snowflake Inc. (NYSE: SNOW) Class A common stock between June 27, 2023 and February 28, 2024. Snowflake is a software company that provides cloud data storage that enables customers to consolidate data onto data-driven applications and share data for the purpose of running analytics and other processes. For more information, submit a form, ema...