

Newsroom
Sorted by: Latest
-
The Cannabist Company Further Extends Forbearance Agreement With Senior Noteholders
CHELMSFORD, Mass.--(BUSINESS WIRE)--The Cannabist Company Holdings Inc. (Cboe CA: CBST) (OTCQB: CBSTF) (“The Cannabist Company” or the “Company”), one of the most experienced cultivators, manufacturers, and retailers of cannabis products in the United States, today announced that the ad hoc group of noteholders of the Company’s 9.25% Senior Secured Notes due December 31, 2028 and the 9.00% Senior Secured Convertible Notes due December 31, 2028 (collectively, the “Notes”), which are parties to t...
-
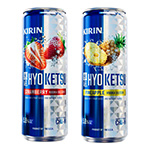
KIRIN HYOKETSU Expands into U.S. RTD Market with Local Production
TOKYO--(BUSINESS WIRE)--New Belgium Brewing, the Kirin Group company leading its U.S. alcoholic beverage business, will launch two original flavors - KIRIN HYOKETSU STRAWBERRY and KIRIN HYOKETSU PINEAPPLE – under the KIRIN HYOKETSU (HYOKETSU) brand, manufactured and sold by Kirin Brewery Company, Limited (Kirin Brewery). The ready to drink cocktail will be available in Hawaii, Tampa, FL, and The Japan Pavilion at EPCOT theme park, operated by Mitsukoshi (U.S.A.), on March 2. Created with Americ...
-
CWH INVESTOR ALERT: Kirby McInerney LLP Investigates Potential Claims Involving Camping World Holdings, Inc.
NEW YORK--(BUSINESS WIRE)--The law firm of Kirby McInerney LLP continues its investigation on behalf of Camping World Holdings, Inc. (“Camping World” or the “Company”) (NYSE:CWH) investors concerning the Company’s and/or members of its senior management’s possible violation of the federal securities laws and other unlawful business practices. [LEARN MORE ABOUT THE INVESTIGATION] What Happened? On October 28, 2025, Camping World issued a press release announcing its third-quarter 2025 financial...
-
REMINDER: Coreweave, Inc. Investors With Significant Losses Must Act By March 13, 2026
NEW YORK--(BUSINESS WIRE)--Kirby McInerney LLP reminds Coreweave, Inc. (“Coreweave” or the “Company”) (NASDAQ:CRWV) investors of the March 13, 2026 deadline to seek the role of lead plaintiff in a pending federal securities class action. Courts do not consider applications filed after this deadline. The lead plaintiff oversees the litigation on behalf of the class and may influence key decisions, including litigation strategy and settlement. Courts regularly appoint individual investors as lead...
-
EPAM SYSTEMS, INC. INVESTOR ALERT: Kirby McInerney LLP Announces Investigation Into Potential Securities Fraud
NEW YORK--(BUSINESS WIRE)--The law firm of Kirby McInerney LLP is investigating potential claims against EPAM Systems, Inc. (“EPAM” or the “Company”) (NYSE:EPAM). The investigation concerns whether the Company and/or members of its senior management may have violated federal securities laws or engaged in other unlawful business practices. [LEARN MORE ABOUT THE INVESTIGATION] What Happened? On February 19, 2026, EPAM reported its financial results for fourth quarter and full year 2025. On an ear...
-
Biocytogen Announces Clinical Milestone with First Patient Dosed in Phase 1 Trial of IDEAYA’s First-in-Class B7H3/PTK7 Bispecific TOP1 ADC IDE034
BEIJING, China--(BUSINESS WIRE)--Biocytogen Pharmaceuticals (Beijing) Co., Ltd. (Biocytogen, SSE: 688796; HKEX: 02315), a global biotechnology company that drives the research and development of novel antibody-based drugs with innovative technologies, today announced that its partner IDEAYA Biosciences, Inc. (“IDEAYA”; Nasdaq: IDYA) has dosed the first patient in IDEAYA’s Phase 1 dose-escalation/expansion clinical trial of IDE034, an investigational B7H3/PTK7 bispecific TOP1 ADC. Pursuant to th...
-
百奥赛图宣布达成重要临床里程碑,合作伙伴IDEAYA启动双抗ADC IDE034 I期临床并完成首例患者给药
中国北京--(BUSINESS WIRE)--(美国商业资讯)-- 百奥赛图(北京)医药科技股份有限公司(以下简称“百奥赛图”,SSE: 688796;HKEX: 02315),一家以创新技术驱动新药研发的国际性生物技术公司,今日宣布,合作伙伴IDEAYA Biosciences, Inc. (Nasdaq: IDYA) 已在一款在研的B7H3/PTK7双特异性TOP1 ADC IDE034 I 期剂量递增/扩展临床试验中完成首例患者给药。根据双方此前签订的选择权及许可协议,首例患者给药将触发IDEAYA向百奥赛图支付500万美元里程碑款。 据IDEAYA介绍,该I期研究旨在评估IDE034作为单药治疗的安全性、耐受性及药代动力学(PK)。随着项目推进,IDEAYA 亦计划探索 IDE034 与 DNA 损伤反应(DDR)相关药物的联合治疗方案,包括其自主研发的口服 PARG 抑制剂 IDE161。IDE034是一款潜在同类首创的B7H3/PTK7双特异性TOP1 ADC,由百奥赛图自主开发,并于2024年7月授权给IDEAYA。IDEAYA表示,IDE034设计的差异化在于当B7H3...
-
Biocytogen Announces Clinical Milestone with First Patient Dosed in Phase 1 Trial of IDEAYA’s First-in-Class B7H3/PTK7 Bispecific TOP1 ADC IDE034
BEIJING--(BUSINESS WIRE)--Biocytogen Pharmaceuticals (Beijing) Co., Ltd. (Biocytogen, SSE: 688796; HKEX: 02315), a global biotechnology company that drives the research and development of novel antibody-based drugs with innovative technologies, today announced that its partner IDEAYA Biosciences, Inc. (“IDEAYA”; Nasdaq: IDYA) has dosed the first patient in IDEAYA’s Phase 1 dose-escalation/expansion clinical trial of IDE034, an investigational B7H3/PTK7 bispecific TOP1 ADC. Pursuant to the compa...
-
Secretary of War Pete Hegseth Visits L3Harris Solid Rocket Motor Site
CAMDEN, Ark.--(BUSINESS WIRE)--Secretary of War Pete Hegseth visited the L3Harris Technologies (NYSE: LHX) Camden site today as part of his nationwide “Arsenal of Freedom” tour, highlighting the importance of American manufacturing capacity in strengthening the defense industrial base and supporting U.S. and allied warfighters. Secretary Hegseth toured several of the site’s solid rocket motor production facilities and spoke with the 1,500 employees who design, build and deliver propulsion syste...

-
National Condom Month: Why Today’s Protection Is About Pleasure, Confidence and Connection, According to Sex & Relationship Expert, Dr. Deb Laino
PHILADELPHIA--(BUSINESS WIRE)--In recognition of National Condom Month, sex and relationship therapist Dr. Deb Laino is encouraging young adults to prioritize safer sex practices - not just for protection, but for the emotional and relational benefits that come with feeling secure and aligned with your partner. As conversations around consent and sexual wellness continue to evolve, Dr. Laino emphasizes that condoms are not just about prevention - they help create a shared understanding of respo...