

Newsroom
Sorted by: Latest
-
Oregon Pacific Bancorp Announces Second Quarter 2026 Earnings Results
FLORENCE, Ore.--(BUSINESS WIRE)--Oregon Pacific Bancorp (ORPB), the holding company of Oregon Pacific Bank, today reported net income of $2.8 million, or $0.38 per diluted share, for the quarter ended June 30, 2026, compared to $2.4 million or $0.33 per diluted share for the quarter ended March 31, 2026. “Our second quarter results reflect the durable foundation built through a consistent commitment to relationship banking, responsible growth, and service to our communities,” said Amber White,...
-
New GLP-1 Clinical Study Finds Calocurb® Reduces Body Weight and Body Fat Without Loss of Muscle Mass
AUCKLAND, New Zealand--(BUSINESS WIRE)--Calocurb, the New Zealand-based company bringing the world the first 100% natural GLP-1 activator, announces today the publication of a new clinical study in US medical journal, Obesity Pillars, demonstrating Calocurb’s effectiveness in weight loss and muscle preservation. In the brand’s fourth human clinical study users saw an average weight loss of 8.3 lbs (3.77 kg) after six months of consistent use paired with ‘real world’ healthy diet and exercise ad...

-
Omnissa Named a Leader in Endpoint Management Platforms by Independent Research Firm
MOUNTAIN VIEW, Calif.--(BUSINESS WIRE)--Omnissa named a Leader in The Forrester Wave™: Endpoint Management Platforms, Q2 2026...
-
Victory Capital Announces Changes to Board of Directors
SAN ANTONIO--(BUSINESS WIRE)--Victory Capital Holdings, Inc. (NASDAQ: VCTR) (“Victory Capital” or the “Company”) announced Dominique Carrel-Billiard’s resignation from its Board of Directors (the “Board”), effective July 23, 2026, due to his leaving Amundi. Concurrently, the Board has appointed Nicolas Calcoen as a Director, effective the same date.Mr. Calcoen’s appointment, recommended by the Board’s Nominating & Governance Committee, adds a seasoned global asset management executive to Vic...
-
Delek US Holdings, Inc. Announces Quarterly Dividend
BRENTWOOD, Tenn.--(BUSINESS WIRE)--Delek US Holdings, Inc. (NYSE:DK) (“Delek”) today announced that its Board of Directors has approved a quarterly dividend of $0.255 per share, to be paid on August 10, 2026, to shareholders of record on August 3, 2026.About Delek US Holdings, Inc.Delek US Holdings, Inc. is a diversified downstream energy company with assets in petroleum refining, logistics, and pipelines. The refining assets consist primarily of refineries operated in Tyler and Big Spring, Texa...
-
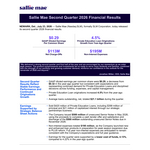
Sallie Mae Reports Second Quarter 2026 Financial Results
NEWARK, Del.--(BUSINESS WIRE)--Sallie Mae (Nasdaq: SLM), formally SLM Corporation, today released second quarter 2026 financial results. Complete financial results and related materials are available at www.SallieMae.com/investors. The materials will also be available on the Securities and Exchange Commission’s website at www.sec.gov. Sallie Mae will host an earnings conference call today, July 23, 2026, at 5:30 p.m. ET. Executives will be on hand to discuss various highlights of the quarter an...
-
Oklo Receives U.S. Department of Energy Startup Authorization for Groves Reactor, Clearing Way for Fuel Loading and First Criticality
LOCKHART, Texas--(BUSINESS WIRE)--Oklo Inc. (NYSE: OKLO) (“Oklo”), an advanced nuclear technology company, today announced it received startup authorization for its Groves Isotope Test Reactor. This authorization, granted under the U.S. Department of Energy (DOE) Reactor Pilot Program, completes DOE’s authorization process and clears the way for fuel loading, startup testing, and reactor operations. Groves is a low-power test reactor designed to demonstrate reactor design, build, and operations...
-
CPI to Report Second Quarter Earnings on August 6, 2026
DENVER--(BUSINESS WIRE)--CPI™ (NASDAQ: PMTS), a payments technology leader providing a comprehensive range of physical and digital payment solutions, will report second quarter 2026 financial results on Thursday, August 6, 2026, at 9:00 a.m. ET.CPI’s financial results for the second quarter will be released before the market opens. The Company’s earnings presentation and live webcast will be available on CPI’s Investor Relations website at the beginning of the conference call.To participate by p...
-
OP Bancorp Declares Quarterly Cash Dividend of $0.14 per Share
LOS ANGELES--(BUSINESS WIRE)--OP Bancorp (the “Company”) (NASDAQ: OPBK), the holding company of Open Bank (the “Bank”), announced today that its Board of Directors declared a quarterly cash dividend of $0.14 per share. The dividend is payable on or about August 20, 2026 to shareholders of record as of the close of business on August 6, 2026.About OP BancorpOP Bancorp, the holding company for Open Bank (the “Bank”), is a California corporation whose common stock is quoted on the Nasdaq Global Mar...
-
Cable One to Host Conference Call to Discuss Second Quarter 2026 Results
PHOENIX--(BUSINESS WIRE)--Cable One, Inc. (NYSE: CABO) will host a conference call with the financial community to discuss results for the second quarter 2026 on Thursday, August 6, 2026 at 5 p.m. Eastern Time (ET). Cable One will issue a press release reporting its results after market close on Thursday, August 6, 2026. The conference call will be available via a live audio webcast on the Cable One Investor Relations website at ir.cableone.net or by dialing 1-833-461-5787 (International: 1-585...