Newsroom
Sorted by: Latest
-
Oshkosh Defense to Showcase Combat-Proven JLTV at International Armoured Vehicles Conference
FARNBOROUGH, England--(BUSINESS WIRE)--Oshkosh Defense, LLC, an Oshkosh Corporation [NYSE: OSK] business, will showcase its Joint Light Tactical Vehicle (JLTV) platform at the International Armoured Vehicles (IAV) Conference, January 20-22, 2026, in Booth D8. The company will highlight how the combat-proven JLTV adapts to evolving operational demands and modernization requirements across allied forces. With over 24,000 vehicles produced for the U.S. Armed Forces and coalition partners worldwide...

-
International Chamber of Commerce, Carbon Measures Announce First Group of Global Experts for Carbon Accounting Panel
PARIS & NEW YORK--(BUSINESS WIRE)--The ICC and Carbon Measures today announced the first cohort of experts selected to serve on the Technical Expert Panel on Carbon Accounting....
-
Sphere Entertainment, the State of Maryland, Prince George’s County, and Peterson Companies Announce Intent to Develop a Sphere at National Harbor
NEW YORK & NATIONAL HARBOR, Md.--(BUSINESS WIRE)--Sphere Entertainment Co. (NYSE: SPHR), the State of Maryland, Prince George’s County, and Peterson Companies announced today their intent to develop a new Sphere venue – which would be the second in the U.S. and first to utilize a smaller-scale design model – at National Harbor, a premier destination in the Washington, D.C. metropolitan area. The addition of Sphere would create a new Maryland landmark that drives significant economic, cultural a...
-
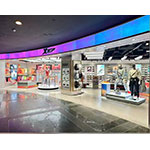
KKV Opens Its Second Global Flagship Store in Ho Chi Minh City
HO CHI MINH CITY, Vietnam--(BUSINESS WIRE)--KK Group today announced the grand opening of the KKV Vietnam Global Flagship Store in downtown Ho Chi Minh City....

-
AI-Powered Creator Monetisation Platform, Fanvue, Hits $100m Run Rate and Raises $22m Series A Investment - as Leading Global Creators Rush to Join the Platform
LONDON--(BUSINESS WIRE)--Fanvue, the AI-powered creator monetisation platform with a $100m-plus run rate, has announced a $22m Series A investment round. Fanvue has bet big on AI-powered tools changing the face of an industry estimated to be worth over $500B by 2030. The platform, which recently crossed $100m annualised revenue, has over 17 million monthly active users, and is home to 250,000 creators who are using Fanvue’s pioneering AI tools to scale their businesses and earn. Instead of comp...
-
Assurant Accelerates APAC Growth with Acquisition of RL Circular Operations
MELBOURNE, Australia--(BUSINESS WIRE)--Assurant, Inc. (NYSE: AIZ), a premier global protection company that safeguards and services connected devices, homes, and automobiles in partnership with the world’s leading brands, today announced its acquisition of RL Circular Operations and related subsidiaries, a reverse logistics division of TIC Group widely recognised as the leading post-purchase workflow and reverse logistics service provider for retailers, manufacturers, and suppliers in Australia...
-
Sharon AI Signs Definitive and Binding Buy-Out Agreement to Divest and Closes its Divestiture of its 50% Ownership Interest in Texas Critical Data Centers LLC For US$70m
NEW YORK--(BUSINESS WIRE)--SharonAI Holdings Inc. and its subsidiaries (“Sharon AI”), a leading Australian Neocloud (SHAZ:OTC Markets, SHAZW:OTC Markets), today announced that it has entered into a definitive agreement to sell its 50% ownership interest in Texas Critical Data Centers LLC (“TCDC”) to New Era Energy & Digital, Inc. (Nasdaq: NUAI) (“New Era”), as previously announced on Dec. 23, 2025, and has closed and consummated the sale. New Era has acquired 100% of the issued and outstand...
-
Comprehensive Channel Upgrade! Xtep Leverages Southeast Asian Foothold to Advance Global Running Footwear Strategy
KUALA LUMPUR, Malaysia--(BUSINESS WIRE)--Running shoes brand Xtep has announced that it will form a joint venture with Bonia, a distributor with over 50 years of market expertise in Malaysia, to jointly develop the Malaysian market. Analysts indicate that this move will accelerate Xtep’s drive to become the leading running brand in Southeast Asia. Notably, this new strategic direction also involves an adjustment to Xtep’s previous business cooperation model in Malaysia. In line with Xtep Group’...
-
CORRECTING and REPLACING Mediacom Communications Announces Visitation and Funeral Arrangements for Rocco B. Commisso
MEDIACOM PARK, N.Y.--(BUSINESS WIRE)--Please replace the release with the following corrected version due to multiple revisions. The updated release reads: MEDIACOM COMMUNICATIONS ANNOUNCES VISITATION AND FUNERAL ARRANGEMENTS FOR ROCCO B. COMMISSO Mediacom Communications today announced visitation and funeral arrangements for its founder, chairman, and chief executive officer, Rocco B. Commisso. First Visitation Second Visitation Monday, January 19, 2026 Tuesday, January 20, 2026 4:00PM - 8:00P...

-
Resecurity Dominates at ITCN Asia 2026 as the Leading Cybersecurity Innovation Partner
LOS ANGELES--(BUSINESS WIRE)--Resecurity®, a global cybersecurity and threat intelligence company trusted by Fortune 100 enterprises and government agencies, is proud to be the leading Cybersecurity Innovation Partner of ITCN Asia 2026, the largest ICT event in the region, taking place from January 17–19, 2026, at Expo Centre Lahore, Pakistan. ITCN Asia is the country’s premier technology event, bringing together government leaders, enterprises, startups, investors, and international technology...