Newsroom
Sorted by: Latest
-
Marathon Asset Management Ltd UK Regulatory Announcement: Form 8.3
LONDON--(BUSINESS WIRE)-- Ap27 FORM 8.3 IRISH TAKEOVER PANEL OPENING POSITION DISCLOSURE/DEALING DISCLOSURE UNDER RULE 8.3 OF THE IRISH TAKEOVER PANEL ACT, 1997, TAKEOVER RULES, 2022 BY PERSONS WITH INTERESTS IN RELEVANT SECURITIES REPRESENTING 1% OR MORE 1. KEY INFORMATION (a) Full name of discloser Marathon Asset Management Limited (b) Owner or controller of interests and short positions disclosed, if different from 1(a) The naming of nominee or vehicle companies is insufficient. For a trust...
-
Simbian Launches AI Threat Hunt Agent, Completing the SecOps Loop
MOUNTAIN VIEW, Calif.--(BUSINESS WIRE)--Simbian®, the pioneer of "Self-Improving SecOps," today released its autonomous AI Threat Hunt Agent. This new Agent independently generates investigative hypotheses, validates them, and roots out hidden threats already lurking within enterprise environments. The Threat Hunt Agent represents the third pillar of Simbian's AI-driven security suite. Together, these three Agents eliminate blind spots across the entire threat timeline: The Present: The AI SOC...

-
Samson Rock Capital LLP UK Regulatory Announcement: Form 8.3
LONDON--(BUSINESS WIRE)-- Ap27 FORM 8.3 IRISH TAKEOVER PANEL OPENING POSITION DISCLOSURE/DEALING DISCLOSURE UNDER RULE 8.3 OF THE IRISH TAKEOVER PANEL ACT, 1997, TAKEOVER RULES, 2022 BY PERSONS WITH INTERESTS IN RELEVANT SECURITIES REPRESENTING 1% OR MORE 1. KEY INFORMATION (a) Full name of discloser SAMSON ROCK CAPITAL LLP (b) Owner or controller of interests and short positions disclosed, if different from 1(a) The naming of nominee or vehicle companies is insufficient. For a trust, the trus...
-
First Trust Global Funds PLC UK Regulatory Announcement: Net Asset Value(s)
LONDON--(BUSINESS WIRE)-- Funds Date TIDM ISIN Code Shares in Issue Currency Net Asset Value NAV/per Share First Trust FactorFX UCITS ETF 31.07.2026 FTFX IE00BD5HBQ97 63,402.00 USD 1,761,356.63 27.781 ...
-
First Trust Global Funds PLC UK Regulatory Announcement: Net Asset Value(s)
LONDON--(BUSINESS WIRE)-- Funds Date TIDM ISIN Code Shares in Issue Currency Net Asset Value NAV/per Share First Trust Vest U.S. Equity Max Buffer UCITS ETF - September 31.07.2026 MSEP.LN IE0009DRFET8 50,002.00 USD 1,401,694.58 28.033 ...
-
First Trust Global Funds PLC UK Regulatory Announcement: Net Asset Value(s)
LONDON--(BUSINESS WIRE)-- Funds Date TIDM ISIN Code Shares in Issue Currency Net Asset Value NAV/per Share First Trust Rising Dividend Achievers UCITS ETF 31.07.2026 RDVY LN IE000K5F6EL4 950,002.00 USD 24,485,900.60 25.775 ...
-
First Trust Global Funds PLC UK Regulatory Announcement: Net Asset Value(s)
LONDON--(BUSINESS WIRE)-- Funds Date TIDM ISIN Code Shares in Issue Currency Net Asset Value NAV/per Share First Trust Vest Nasdaq-100 Moderate Buffer UCITS ETF - June 31.07.2026 QJUN.LN IE000HFBJ0U0 4,150,002.00 USD 90,800,637.10 21.880 ...
-
First Trust Global Funds PLC UK Regulatory Announcement: Net Asset Value(s)
LONDON--(BUSINESS WIRE)-- Funds Date TIDM ISIN Code Shares in Issue Currency Net Asset Value NAV/per Share First Trust RBA American Industrial Renaissance UCITS ETF 31.07.2026 AIRR LN IE000U6ABUJ7 7,650,002.00 USD 217,764,782.33 28.466 ...
-
Samson Rock Capital LLP UK Regulatory Announcement: Form 8.3
LONDON--(BUSINESS WIRE)-- FORM 8.3 PUBLIC OPENING POSITION DISCLOSURE/DEALING DISCLOSURE BY A PERSON WITH INTERESTS IN RELEVANT SECURITIES REPRESENTING 1% OR MORE Rule 8.3 of the Takeover Code (the “Code”) 1. KEY INFORMATION (a) Full name of discloser: SAMSON ROCK CAPITAL LLP (b) Owner or controller of interests and short positions disclosed, if different from 1(a): The naming of nominee or vehicle companies is insufficient. For a trust, the trustee(s), settlor and beneficiaries must be named....
-
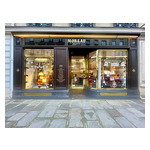
Historic French Luxury Leather Goods House Moreau Paris Sold to Leading Manufacturer
PARIS--(BUSINESS WIRE)--ASTEREN announces that the Paris Commercial Court has approved the acquisition of Moreau Paris, one of France’s most prestigious luxury leather goods houses, by Cardinal Invest, owner of the French luxury manufacturer Groupe Lécuyer. The transaction concludes a competitive international sale process conducted under the supervision of the Paris Commercial Court and marks the beginning of a new chapter for one of the last independent historic Paris monogram houses. Led by...