Newsroom
Sorted by: Latest
-
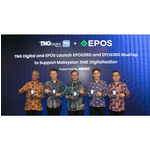
TNG Digital and EPOS Launch EPOS360 and EPOS360 BlueTap in Malaysia to Help Local SMEs Grow with AI and Unique Payment Capabilities
KUALA LUMPUR, Malaysia--(BUSINESS WIRE)--TNG Digital Sdn. Bhd. (“TNG Digital”), the operator of Malaysia’s leading digital financial services and lifestyle app, TNG eWallet, and EPOS, the all-in-one SME transformation platform of Ant International, have jointly announced the launch of EPOS360 in Malaysia, with a suite of AI-powered growth tools and unique payment capabilities to support the digitalisation of Malaysian businesses, particularly SMEs. CEO of MDEC, Anuar Fariz Fadzil said, "The lau...
-
Cinemo and Renault Korea enhance in-car video experience in the all-new FILANTE
KARLSRUHE, Germany--(BUSINESS WIRE)--Cinemo, a global leader and highly innovative one-stop-shop provider for fully integrated digital media products, announces the continued expansion of its cooperation with Renault Korea, integrating CARS Online Video into the all-new FILANTE. Building on the success of their proven collaboration, Renault Korea selected Cinemo once more to enable a seamless, multi-screen in-car video experience designed for Android Automotive OS (AAOS). FILANTE brings Renault...

-
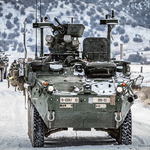
Teledyne FLIR Defense Wins $32 Million Contract to Provide Recon Surveillance Kit on Strykers for Bulgaria
BOSTON--(BUSINESS WIRE)--Teledyne FLIR Defense, part of Teledyne Technologies Incorporated (NYSE:TDY), announced that it has been awarded a contract by the U.S. Army worth up to $32 million to deliver and integrate advanced electro-optical (EO/IR) systems for the Stryker Infantry Carrier Vehicle (ICV) Recon Kit. The contract was awarded by the U.S. Army Contracting Command at Aberdeen Proving Ground, Md., as part of a Foreign Military Sales agreement to support Bulgaria’s military modernization...
-
CRH plc UK Regulatory Announcement: Transaction in Own Shares
NEW YORK--(BUSINESS WIRE)-- 15th January 2026 CRH plc Transaction in Own Shares CRH plc (“CRH”) announces that on 14th January 2026 it acquired the following number of its ordinary shares (the “ordinary shares”) in the United States through CRH’s broker Santander US Capital Markets LLC. The ordinary shares acquired (by way of redemption) will be cancelled. Aggregate number of ordinary shares acquired Daily volume weighted average price paid Daily highest price paid per share Daily lowest price...
-
O Brasil lidera o mundo em pesquisa global sobre segurança de identidade: O relatório RSA ID IQ revela as principais ameaças à identidade
BRASÍLIA, Brasil--(BUSINESS WIRE)--Um novo relatório global da RSA, líder em identidade com foco em segurança, revela que a identidade foi responsável por violações de dados mais frequentes e mais caras neste ano em comparação ao anterior. O Relatório RSA ID IQ 2026 apresenta insights críticos de mais de 2.100 profissionais de cibersegurança, identidade e gerenciamento de acesso (IAM) e TI sobre a frequência com que falhas de identidade impactam as organizações, os efeitos financeiros sofridos...

-
Brazil Leads the World in Global Identity Security Survey: RSA ID IQ Report Unveils Top Identity Threats
BRASÍLIA, Brazil--(BUSINESS WIRE)--A new global report from RSA, the security-first identity leader, reveals that identity caused both more frequent and more expensive data breaches this year than last. The 2026 RSA ID IQ Report reveals critical insights from more than 2,100 cybersecurity, identity and access management (IAM), and IT professionals on how frequently identity fails organizations, the financial impacts their organizations suffered when it did, attitudes on AI’s cybersecurity poten...

-
UK CfD AR7 Results Signal New Realities for Offshore Wind Economics Ahead of AR8 — Aegir Insights
COPENHAGEN, Denmark--(BUSINESS WIRE)--The UK government yesterday published the results of the highly anticipated Contracts for Difference (CfD) Allocation Round 7 (AR7), highlighting both sustained appetite for UK offshore wind and the growing complexity of delivering competitive, bankable bids. The allocation round awarded a record 8.4 GW of offshore wind capacity across eight projects after the government increased the budget during the process. Almost all capacity (8.2 GW) was allocated to...
-
TwentyTwo Real Estate et Farallon Capital finalisent un investissement de 761 millions d'euros dans Isemia, une société immobilière spécialisée dans le secteur de la santé, valorisée à 1,2 milliard d'euros et créée avec emeis
PARIS--(BUSINESS WIRE)--TwentyTwo Real Estate, société européenne indépendante d'investissement et de gestion immobilière, annonce la finalisation, aux côtés de Farallon Capital, d'un investissement de 761 millions d'euros qui a conduit à la création d'Isemia (www.isemiabyemeis.com), société leader dans l'immobilier de santé, détenant un portefeuille d'actifs d'une valeur de 1,2 milliard d'euros géré par emeis. Cette transaction représente une étape majeure dans la stratégie d'investissement à...

-
Samenvatting: TwentyTwo Real Estate en Farallon Capital ronden investering van € 761 miljoen dollar af in Isemia, een vastgoedonderneming in de zorgsector met een waarde van € 1,2 miljard, opgericht in samenwerking met emeis
PARIJS--(BUSINESS WIRE)--TwentyTwo Real Estate, een onafhankelijke Europese vastgoedbeleggings- en -beheermaatschappij, kondigt de afronding aan van een investering van € 761 miljoen, samen met Farallon Capital, die heeft geleid tot de oprichting van Isemia (www.isemiabyemeis.com), een toonaangevende vastgoedonderneming in de zorgsector met een portfolio van € 1,2 miljard aan activa die worden beheerd door emeis. De transactie vormt een belangrijke mijlpaal in de langetermijnbeleggingsstrategie...

-
Resumen: TwentyTwo Real Estate y Farallon Capital completan una inversión de 761 millones de euros en Isemia, una empresa inmobiliaria dedicada al sector sanitario valorada en 1200 millones de euros y creada junto con emeis
PARÍS--(BUSINESS WIRE)--TwentyTwo Real Estate, una empresa europea independiente dedicada a la inversión y gestión inmobiliaria, anuncia la finalización, junto con Farallon Capital, de una inversión de 761 millones de euros que ha dado lugar a la creación de Isemia (www.isemiabyemeis.com), una empresa inmobiliaria líder en el sector sanitario que cuenta con una cartera de activos valorada en 1200 millones de euros y gestionada por emeis. La operación supone un hito importante en la estrategia d...