Newsroom
Sorted by: Latest
-
Computershare Trustees (Jersey) Limited UK Regulatory Announcement: Form 8.3
LONDON--(BUSINESS WIRE)-- FORM 8.3 PUBLIC OPENING POSITION DISCLOSURE/DEALING DISCLOSURE BY A PERSON WITH INTERESTS IN RELEVANT SECURITIES REPRESENTING 1% OR MORE Rule 8.3 of the Takeover Code (the “Code”) 1. KEY INFORMATION (a) Full name of discloser: Computershare Trustees (Jersey) Limited as trustee of the Schroders Employee Benefit Trust (b) Owner or controller of interests and short positions disclosed, if different from 1(a): The naming of nominee or vehicle companies is insufficient. Fo...
-
Endesa, S.A. UK Regulatory Announcement: Half-year Financial Report
MADRID--(BUSINESS WIRE)-- First Half 2026 Consolidated results July 29th, 2026 You will find the information on our 1H 2026 Results on our website https://www.endesa.com/en/shareholders-and-investors/news More specifically: 1H 2026 RESULTS PRESENTATION CONSOLIDATED MANAGEMENT REPORT CONSOLIDATED FINANCIAL STATEMENTS PRESS RELEASE ALTERNATIVE PERFORMANCE INDICATORS...
-
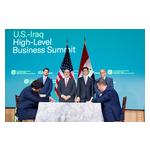
T964 Named as Uptime Institute Business Partner to Power Iraq’s Digital Infrastructure
WASHINGTON--(BUSINESS WIRE)--Uptime Institute and Tech964 Holding Limited (T964) announced a strategic partnership to accelerate Iraq’s digital transformation....
-
Play for the Breakthrough: Logitech G PLAY 2026 Comes to Los Angeles, Warsaw, and Shanghai
LAUSANNE, Switzerland & SAN JOSE, Calif.--(BUSINESS WIRE)--Logitech G is embarking on an unprecedented expansion, announcing the official return of its premier global flagship event, Logitech G PLAY 2026 on September 23rd, 2026. Logitech G PLAY 2026 will come to life across three flagship locations around the world.The celebration begins in Warsaw at Warszawskie Centrum EXPO XXI, where Logitech G will host a professional esports tournament on September 22nd. On September 23rd, Logitech G PLAY wi...

-
PK MED Strengthens Its Strategic and Scientific Governance to Support the Development of Its Therapeutic Micro-implants
PARIS & LYON, France--(BUSINESS WIRE)--PK MED, a French biotechnology company founded by Truffle Capital (founder of Abivax and Carvolix), developing therapeutic micro-implants to address major medical needs, today announces a significant strengthening of its governance. The company is strengthening the structure of its Board of Directors and Scientific Advisory Board to support the upcoming Phase 2 entry of its most advanced drug candidate, ARTHRELIS (treatment of gout flares), and to accelera...
-
PK MED renforce sa gouvernance stratégique et scientifique pour soutenir le développement de ses micro-implants thérapeutiques
PARIS & LYON, France--(BUSINESS WIRE)--PK MED, société de biotechnologie française fondée par Truffle Capital (fondateur notamment d’Abivax et de Carvolix) développant des micro-implants thérapeutiques pour répondre à des besoins médicaux majeurs, annonce aujourd'hui un renforcement significatif de sa gouvernance. La société renforce la structure de ses Conseils d'administration et scientifique afin de soutenir l'entrée prochaine en Phase 2 de son candidat-médicament le plus avancé, ARTHRELIS (...
-
OneChronos Launches European Trading Venues to Bring New Market Design and Optimisation to Pan-European Equities
LONDON & AMSTERDAM--(BUSINESS WIRE)--OneChronos today announced the production launch of its European trading venues, OneChronos Markets UK Limited and OneChronos Markets NL B.V., providing institutional investors with access to pan-European equities and equity-like instruments through a fundamentally different approach to market design and best execution. The launch represents the next milestone in OneChronos' international growth strategy, extending its distinctive market model into Europe th...

-
ustwo brings AI governance to the boardroom with appointment of Google DeepMind executive Simon Bouton
LONDON--(BUSINESS WIRE)--ustwo, the global employee-owned B Corp digital product studio, today announced the appointment of Simon Bouton, Chief Experience Officer at Google DeepMind, as its first AI Non-Executive Director. Bouton joins the board to provide independent oversight of ustwo’s AI strategy, reflecting the studio’s conviction that artificial intelligence has evolved from a technology initiative into a board-level responsibility. The appointment builds on ustwo's AI leadership, includi...

-
ELFA Vape Aerosols Less Harmful Than Cigarette Smoke: Study
SHENZHEN, China--(BUSINESS WIRE)--Levels of 17 constituents in aerosols from ELFA, a pod system vape by ELFBAR, are undetected or substantially lower than those in cigarette smoke, reveals the latest peer-reviewed study published by iScience, a scientific journal. Aerosols in this study are generated by facilities under standardized laboratory conditions. The tests involve 17 cigarette smoke-related analytes during vaporization of vape liquid from ELFA’s pods in four flavors, including Super To...
-
Boomi調査で判明:企業の86%がAIエージェントを導入済み、一方で信頼している企業はわずか34%
ペンシルベニア州コンショホッケン--(BUSINESS WIRE)--(ビジネスワイヤ) -- ※本リリースは、Boomi, LP.が2026年7月20日(米国時間)に発表したリリースの日本語訳です。 AI時代のデータアクティベーションカンパニー(データを価値に変える)であるBoomi™, LP.(所在地:米国ペンシルバニア州、CEO:Steve Lucas、以下、Boomi)およびBoomi株式会社(所在地:東京都渋谷区、代表取締役社長 CEO 河野 英太郎)は本日、BoomiがForrester Consultingに委託して実施した新たな調査結果を発表しました。同調査では、企業によるAIエージェントの導入が急速に進む一方で、AIエージェントへの信頼が導入・活用への意欲に追いついていない実態が明らかになりました。 北米・欧州・アジア太平洋地域(APAC)のIT・技術分野におけるディレクター職以上の意思決定者409名を対象としたForresterの調査では、86%の企業がAIエージェントの実証(PoC)段階を脱して本番導入へと踏み出している一方、AIエージェントの判断や行動を信頼し...