

Newsroom
Sorted by: Latest
-
FDA Issues Modified Risk Tobacco Product Orders for 20 ZYN Nicotine Pouch Products
STAMFORD, CT--(BUSINESS WIRE)--Philip Morris International Inc. (PMI) (NYSE: PM) today announced that the U.S. Food and Drug Administration (FDA) issued Modified Risk Tobacco Product (MRTP) orders for 20 variants of ZYN nicotine pouch products. These are the first MRTP orders granted for nicotine pouches, allowing PMI U.S. to market the following claim for the authorized ZYN products: “Using ZYN instead of cigarettes puts you at a lower risk of mouth cancer, heart disease, lung cancer, stroke,...
-
JIHYO of Global K-Pop Phenomenon TWICE and GRAMMY®-Nominated Dancehall Star Shenseea Join Forces for Bold New Single “Distant Lover,” Out July 10th
LOS ANGELES--(BUSINESS WIRE)--Global music continues to erase borders as JIHYO, from the record-breaking K-pop group TWICE, joins forces with GRAMMY®-nominated Jamaican artist Shenseea for their electrifying new collaboration, “Distant Lover,” arriving worldwide on July 10th, along with its official music video, which will also be released the same day. Blending K-pop, rap, dancehall, and Afrobeats influences into an irresistible summer soundtrack, “Distant Lover” pairs two of music’s most dyna...

-
Law Offices of Frank R. Cruz Encourages First Solar, Inc. (FSLR) Shareholders To Inquire About Securities Fraud Class Action
LOS ANGELES--(BUSINESS WIRE)--Law Offices of Frank R. Cruz Encourages First Solar, Inc. (FSLR) Shareholders To Inquire About Securities Fraud Class Action...
-
Vaudit Launches TokenAudit to Recover Millions in Enterprise Token Spend Billing Errors From Anthropic, OpenAI, and AI Providers
SAN FRANCISCO--(BUSINESS WIRE)--Vaudit, the company building an independent verification layer across AI, cloud and enterprise billing, today launched TokenAudit to help companies audit AI bills against contract terms and recover money when billing errors occur. Since March, Vaudit has reviewed $34 million in AI spending across 60 companies and identified nearly $1.7 million in mistaken overcharges, with roughly 80% credited back by providers or cloud platforms, including AWS, Google Cloud, Mic...
-
Retractable Technologies, Inc. Declares Dividends to Series II and III Class B Preferred Stock Shareholders
LITTLE ELM, Texas--(BUSINESS WIRE)--Retractable Technologies, Inc. (“Retractable”) (NYSE American: RVP) announced today that its Board of Directors has declared dividends to holders of its Series II Class B and Series III Class B Convertible Preferred Stock in the amounts of $39,050.00 and $18,561.25, respectively. Dividends have accrued at $1.00 per share per annum. The dividends cover the period beginning April 1, 2026 through June 30, 2026. The dividends will be paid on July 20, 2026 to shar...
-
INTEXA: Report du délai de réunion de l’Assemblée générale ordinaire annuelle des actionnaires
SAINT-ETIENNE, France--(BUSINESS WIRE)--Regulatory News: INTEXA (Paris:ITXT) Suite à la réunion du Conseil d’administration de la Société du 5 juin 2026 au cours de laquelle les administrateurs ont pris acte qu’ils ne disposaient pas de tous les éléments nécessaires pour arrêter les comptes de l’exercice clos le 31 décembre 2025, la Société annonce avoir sollicité et obtenu auprès de la Présidente du Tribunal de commerce de Saint-Etienne une prorogation du délai de réunion de l’Assemblée généra...
-
Pet Service Holding N.V. Announces Unanimous Approval of All Agenda Items at the Annual General Meeting of Shareholders
ZAANSTAD, Netherlands--(BUSINESS WIRE)--Regulatory News: Pet Service Holding NV (Euronext Growth Paris, ISIN: NL0015001HZ9 / Ticker: ALPET), announces that all agenda items submitted for voting at the Annual General Meeting of Shareholders, held on 30 June 2026 in Zaanstad, were unanimously approved. Among other matters, the shareholders approved: the adoption of the 2025 annual financial statements; the appropriation of the result for the financial year 2025; the discharge of the members of th...
-
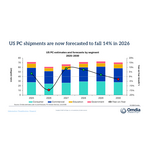
Omdia: US PC Shipments Fell 7.0% in 1Q26, Marking Steepest Decline Since 2023
LONDON--(BUSINESS WIRE)--The latest research from Omdia shows that US PC shipments (excluding tablets) fell 7.0% year-over-year in Q1 2026 to 15.8 million units, the largest annual decline since Q3 2023. The downturn reflects component supply constraints and cost pressures from surging PC memory and storage prices, compounded by a demand hangover following the Windows 11 refresh cycle, which had exhaust much of the near-term commercial pipeline. is the comparison was also affected by a strong Q...
-
Pet Service Holding N.V. annonce l'adoption à l'unanimité de l’ensemble des résolutions présentées à l'assemblée générale annuelle des actionnaires
ZAANSTAD, Pays-Bas--(BUSINESS WIRE)--Regulatory News: Pet Service Holding NV (Euronext Growth Paris, ISIN : NL0015001HZ9 / Mnémonique : ALPET), annonce que toutes les résolutions soumises au vote lors de l'assemblée générale annuelle des actionnaires, qui s'est tenue le 30 juin 2026 à Zaanstad, ont été approuvées à l'unanimité. Entre autres points, les actionnaires ont approuvé : l'adoption des comptes annuels de l'exercice 2025 ; l'affectation du résultat de l'exercice 2025 ; le quitus aux mem...
-
A Record $5 Million Announced to Support Creative Youth Development Programs Across Washington State
SEATTLE--(BUSINESS WIRE)--Allen Family Philanthropies today announced $5 million in new funding to strengthen and expand access to Creative Youth Development (CYD) programs across Washington State. Ten organizations, representing 11 counties across the state and a range of creative disciplines, have received funding to grow their respective CYD programs. This signifies the state’s largest, single-investment into community-led, out-of-school-time CYD for youth (ages 13-26).When youth are activate...