

Newsroom
Sorted by: Latest
-
Orion Digital Receives Nasdaq Notification Regarding Minimum Bid Price Deficiency
VANCOUVER, British Columbia--(BUSINESS WIRE)--Orion Digital Corp. (NASDAQ:ORIO) (TSX:ORIO) (“Orion Digital” or the “Company”), today announced that on June 25, 2026, it received a written notification (the “Notification Letter”) from the Listing Qualifications Department of The Nasdaq Stock Market LLC (“Nasdaq”) indicating that, for the last thirty consecutive business days, the bid price for the Company’s common shares (the “Shares”) had closed below the minimum US$1.00 per share requirement f...
-
Brera Holdings PLC (d/b/a Solmate Infrastructure) Announces Results of 2026 Annual General Meeting; Shareholders Decisively Re-Elect All Company’s Five Director Nominees by Wide Margins
DUBLIN--(BUSINESS WIRE)--Brera Holdings PLC (Nasdaq: SLMT) (the “Company” or “Solmate”) today announced the voting results in respect of Proposal No. 1 and Proposal No. 2 of its 2026 Annual General Meeting of Shareholders (the “AGM”), held on June 26, 2026. At the AGM, shareholders duly re-elected all five of the Company’s director nominees - Ron Sade, Alyazi Saeed Ahmad Alkhattal Almheiri, Erez Simha, Tariq Salem Ebraheem Alsaman Alnuaimi and Keren Maimon, each by a wide margin, with support r...
-
Duty of Vigilance: TotalEnergies’ Reaction to the Decision of the Paris Judicial Court
PARIS--(BUSINESS WIRE)--TotalEnergies (Paris:TTE) (LSE:TTE) (NYSE:TTE) notes with satisfaction that, in its decision issued today, the Paris Judicial Court did not uphold the claims brought by the associations and the City of Paris, which sought to prohibit TotalEnergies from developing or undertaking new oil and gas projects or to require it to reduce its oil and gas production. Indeed, the ruling confirms that the duty of vigilance law “is not intended to hold the companies concerned responsi...
-
Devoir de vigilance : réaction de TotalEnergies à la décision du tribunal judiciaire de Paris
PARIS--(BUSINESS WIRE)--TotalEnergies (Paris:TTE) (LSE:TTE) (NYSE:TTE) constate avec satisfaction que le tribunal judiciaire de Paris n’a pas retenu dans sa décision de ce jour les demandes des associations et de la ville de Paris qui visaient à faire interdire à TotalEnergies les nouveaux projets pétroliers et gaziers ou à l’obliger à réduire sa production de pétrole et de gaz. En effet, le jugement confirme que la loi sur le devoir de vigilance « n'est pas destinée à rendre les entreprises co...
-
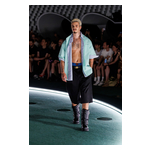
A First Look at the UGG Willy Chavarria Collaboration Lands in Paris. Two Brands that Defined American Style Bring a Bold Creative Lens for Men & Women.
--(BUSINESS WIRE)--UGG: WHAT Making its surprise global debut on June 26, 2026 during Spring / Summer 2027 Paris Fashion Week, Southern California-based global lifestyle brand UGG® appeared on the runway at the Willy Chavarria show. In an unexpected meeting of two beloved fashion worlds, the iconic brands unveiled a coveted tease of their unisex collaboration, arriving this fall. The collaboration between UGG® and Willy Chavarria unites two brands that have built cultural influence through ic...
-
Attorneys Say SCOTUS Ruling in Roundup Case Unlikely to Affect Many Victims’ Claims
DALLAS--(BUSINESS WIRE)--A U.S. Supreme Court ruling that the makers of Roundup weedkiller cannot be sued for failing to include a cancer warning on its label will not preclude litigation from moving forward says a group of attorneys representing thousands of cancer victims who used the herbicide for years without suspecting it could cause them cancer. “While we’re disappointed with the Durnell ruling, the language of the decision makes clear that its scope is limited to failure-to-warn claims,...
-
Capco因在创新和负责任人工智能领导力方面的成就而获得OpenAI认可
伦敦--(BUSINESS WIRE)--(美国商业资讯)-- 全球管理与技术咨询公司Capco(隶属Wipro)因在人工智能创新和负责任人工智能领导力方面的成就而获得OpenAI认可。 在近期于旧金山举行的2026年OpenAI合作伙伴峰会上,Capco荣获人工智能治理与风险卓越奖(AI Governance & Risk Excellence Award),这彰显了Capco在高度受监管的环境中交付企业级人工智能成果的能力。该奖项肯定了Capco的专业优势,能够协助金融服务和能源企业自信地扩大人工智能应用规模,在创新与严格治理之间取得平衡,从而降低风险、加强合规并改善客户成果。 此前,Capco刚刚在OpenAI Codex黑客马拉松(OpenAI Codex Hackathon)中夺冠,其英国人工智能实验室在比赛中与来自OpenAI合作伙伴生态系统的30多支队伍、100余名参赛者展开角逐。Capco的获奖作品Sentra是一款以咨询为导向、由人工智能驱动的零售银行解决方案,它利用数字孪生技术识别脆弱客户,并为一线团队推荐可解释的次优行动方案。 Wipro Limited首...
-
Samenvatting: Capco door OpenAI erkend voor innovatie en leiderschap op het gebied van verantwoorde AI
LONDEN--(BUSINESS WIRE)--Het wereldwijde management- en technologieadviesbureau Capco, een dochteronderneming van Wipro, is door OpenAI erkend voor zowel AI-innovatie als verantwoord leiderschap op het gebied van AI. Capco ontving de AI Governance & Risk Excellence Award tijdens de recente OpenAI Partner Summit 2026 in San Francisco. Deze onderscheiding bevestigt het vermogen van Capco om AI-resultaten op bedrijfsniveau te leveren in sterk gereguleerde omgevingen. De prijs erkent de experti...
-
Capco wird von OpenAI für Innovationen und vorbildlichen Umgang mit KI ausgezeichnet
LONDON--(BUSINESS WIRE)--Die weltweit tätige Unternehmens- und Technologieberatung Capco, ein Wipro Unternehmen , wurde von OpenAI sowohl für seine KI-Innovationen als auch für seine verantwortungsvolle Führungsrolle in diesem Bereich gewürdigt. Capco wurde mit dem AI Governance & Risk Excellence Award auf dem OpenAI Partner Summit 2026 in San Francisco ausgezeichnet. Hervorgehoben wurde die Fähigkeit von Capco, KI-Ergebnisse auf Unternehmensniveau in stark regulierten Umgebungen zu liefern...
-
SNT Counsel, the AI Litigation Platform from SNT Labs, Powers George Pino’s Defense to Verdict
MIAMI--(BUSINESS WIRE)--SNT Counsel, the AI litigation platform from SNT Labs, gave a Miami defense team continuous, real-time trial support throughout one of the year’s most closely watched cases. The State of Florida charged George Pino with vessel homicide and manslaughter after he crashed his 29-foot motorboat into a navigational marker, killing one teenage girl and permanently paralyzing another. The defense argued from the start that the incident was an accident and not a crime. On June 2...