Newsroom
Sorted by: Latest
-
Resumen: Grupos taiwaneses interpretan el erhu y la ocarina en las Jornadas Folclóricas de Praga
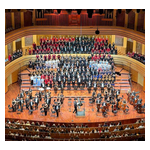
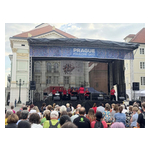
TAIPÉI, Taiwán--(BUSINESS WIRE)--Las Jornadas Folclóricas de Praga 2026 se celebraron los días 17 y 18 de julio en el corazón de esa ciudad y reunieron 56 grupos artísticos internacionales procedentes de Alemania, Austria, Eslovaquia, España, los Países Bajos y Polonia. Participaron cuatro grupos taiwaneses: la banda de ocarinas de Hildebrand Yu, la Orquesta Shi-xian Huqin, la Orquesta Folclórica de Taipéi y el conjunto Four Strings Ensemble. La banda oficial representante de Taiwán, dirigida p...
-
Riassunto: Gruppi musicali taiwanesi si esibiscono suonando l'erhu e l'ocarina al festival Prague Folklore Days
TAIPEI,Taiwan--(BUSINESS WIRE)--Il festival Prague Folklore Days 2026 si è svolto il 17 e 18 luglio nel cuore di Praga, con la partecipazione di 56 gruppi di artisti provenienti da Germania, Austria, Slovacchia, Spagna, Paesi Bassi e Polonia. Quattro gruppi taiwanesi hanno partecipato alla kermesse: i suonatori di ocarina di Hildebrand Yu, l'Orchestra Shi-xian Huqin, l'Orchestra Taipei Folk e il Four Strings Ensemble. Sotto la direzione di Huang Chun-sin, il gruppo di Taiwan ha presentato una v...

-
Samenvatting: Taiwanese ensembles demonstreren erhu en ocarina tijdens de Prague Folklore Days
TAIPEI, Taiwan--(BUSINESS WIRE)--Op 17 en 18 juli was het centrum van Praag het toneel van de Prague Folklore Days 2026, waar 56 internationale kunstgroepen uit Duitsland, Oostenrijk, Slowakije, Spanje, Nederland en Polen bijeenkwamen. Er namen ook vier Taiwanese groepen deel: Hildebrand Yu’s ocarina band, de Shi-xian Huqin Orchestra, de Taipei Folk Orchestra en het Four Strings Ensemble. Onder leiding van Huang Chun-sin bracht de band die Taiwan officieel vertegenwoordigde een diverse line-up...

-
Quatre troupes taïwanaises brillent au Festival Off d’Avignon en France
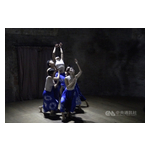
TAIPEI, Taïwan--(BUSINESS WIRE)--Célébrant sa 60e édition, le Festival Off d’Avignon s’est déroulé du 4 au 25 juillet, proposant 1 780 représentations dans plus de 140 salles à travers la ville. Marquant sa 20e année de participation à ce célèbre festival artistique international, Taïwan a mis en vedette quatre compagnies artistiques exceptionnelles : Chun Dance, le Kuo-Shin Chuang Pangcah Dance Theatre, le Dashing Theater et la Seed Dance Company. Elles ont présenté leurs productions acclamées...
-
Des groupes taïwanais mettent à l’honneur l’erhu et l’ocarina à l’occasion des Journées folkloriques de Prague
TAIPEI,Taiwan--(BUSINESS WIRE)--L’édition 2026 des Journées folkloriques de Prague (Prague Folklore Days 2026) s’est déroulée les 17 et 18 juillet au cœur de Prague, réunissant 56 groupes artistiques internationaux venus d’Allemagne, d’Autriche, de Slovaquie, d’Espagne, des Pays-Bas et de Pologne. Quatre groupes taïwanais y ont également participé : l’ensemble d’ocarinas d’Hildebrand Yu, l’orchestre Shi-xian Huqin, l’orchestre folklorique de Taipei et le Four Strings Ensemble. Mené par Huang Ch...

-
Prager Folkloretage: Taiwanische Ensembles präsentieren Erhu und Okarina
TAIPEH,Taiwan--(BUSINESS WIRE)--Die Prager Folkloretage 2026 fanden vom 17. bis 18. Juli im Herzen von Prag statt und brachten 56 internationale Künstlergruppen aus Deutschland, Österreich, der Slowakei, Spanien, den Niederlanden und Polen zusammen. Unter den Teilnehmern waren auch vier taiwanische Gruppen, nämlich Hildebrand Yus Okarina-Band, das Shi-xian Huqin-Orchester, das Taipeh-Folklore-Orchester sowie das Four Strings Ensemble. Unter der Leitung von Huang Chun-sin präsentierte das offizi...

-
Pierre & Vacances-Center Parcs : Chiffre d’affaires du 3ème trimestre de l’exercice 2025/2026
PARIS--(BUSINESS WIRE)--Hausse du chiffre d’affaires économique des activités touristiques de 2,2% au 3ème trimestre 2025/2026....

-
Pierre & Vacances-Center Parcs: Third Quarter 2025/2026 Revenue
PARIS--(BUSINESS WIRE)--Regulatory News: Franck Gervais, CEO of Pierre & Vacances-Center Parcs (Paris:VAC), stated: “Growth in the Group’s tourism businesses continued over the quarter driven by all of the brands. Against a tense international backdrop, these results confirm the robust and resilient nature of our local tourism model as favoured by our customers whose satisfaction ratings were up across all of our brands. Reservations for the summer period are strong, underpinned especially...

-
Havas Reports Solid H1 2026 Results With Organic Growth of +2.5% and Further Improvement in Adjusted EBIT Margin
PARIS--(BUSINESS WIRE)--Havas reports solid H1 2026 results with organic growth of +2.5% and further improvement in adjusted EBIT margin...
-
Resumen: Los coros infantiles de Taiwán arrasan en un concurso coral en Hungría
TAIPÉI, Taiwán--(BUSINESS WIRE)--En la competencia con 36 participantes destacados de 20 países, cuatro coros infantiles taiwaneses han ganado varios premios importantes y honores máximosen la V Edición del Festival Coral Internacional de Budapest, poniendo de manifiesto la diversidad cultural y la excelencia musical de Taiwán. Con sus voces diáfanas y angelicales y una excelente técnica vocal, el Coro Infantil Puzangalan, del condado de Pingtung, se alzó con el máximo galardón, el "Laurea Summ...