Newsroom
Sorted by: Latest
-
Meta与AWS签署协议,依托AWS Graviton芯片赋能智能体AI
西雅图--(BUSINESS WIRE)--(美国商业资讯)-- Meta已签署一项协议,将规模化部署AWS Graviton处理器。随着Meta推进下一代AI建设,本次合作标志着双方长期伙伴关系迎来重大扩展。 部署初期将投放数千万个Graviton计算核心,并可随着Meta的AI能力发展而灵活扩容。此次合作反映出AI基础设施建设模式的转变:图形处理器(GPU)对于训练大模型仍然至关重要,但智能体AI的快速发展催生了大量中央处理器(CPU)密集型工作负载需求,涵盖实时推理、代码生成、搜索服务和多步骤任务编排。Graviton5专为这类工作负载量身打造,为Meta提供高效、规模化运行这些任务的处理能力。 这些芯片将为Meta的各类工作负载提供动力,包括支持公司的AI计划。该工作需要能够处理数十亿次交互、同时协调复杂的多步骤智能体工作流程的基础设施,而这正是Graviton芯片所擅长的CPU密集型工作。 如需了解完整信息,请访问关于Amazon。 关于Amazon Web Services Amazon Web Services (AWS)始终以客户至上、创新速度、追求卓越运营和长远思考为...

-
Meta與AWS簽署協議,利用AWS Graviton晶片賦能代理式AI
西雅圖--(BUSINESS WIRE)--(美國商業資訊)-- Meta已簽署一項協議,將規模化部署AWS Graviton處理器。隨著Meta推進下一代AI建設,本次合作代表雙方長期夥伴關係迎來重大升級。 部署初期將投放數千萬個Graviton運算核心,並可隨著Meta的AI能力發展而靈活擴容。此次合作反映出AI基礎設施建設模式的改變:圖形處理器(GPU)對於訓練大模型仍然至關重要,但代理式AI的快速發展催生了大量中央處理器(CPU)密集型工作負載需求,涵蓋即時推理、程式碼生成、搜尋服務和多步驟任務編排。Graviton5專為這類工作負載量身打造,為Meta提供高效、規模化運行這些任務的處理能力。 這些晶片將為Meta的各類工作負載提供動力,包括支援公司的AI計畫。該工作需要能夠處理數十億次互動、同時協調複雜的多步驟代理工作流程的基礎設施,而這正是Graviton晶片所擅長的CPU密集型工作。 如欲瞭解完整資訊,請造訪關於Amazon。 關於Amazon Web Services Amazon Web Services (AWS)始終以客戶至上、創新速度、追求卓越營運和長遠思考為指...

-
Meta signe un accord avec AWS pour faire fonctionner son IA agentique à partir des puces Graviton d’AWS
SEATTLE--(BUSINESS WIRE)--Meta a signé un accord pour déployer à grande échelle les processeurs AWS Graviton. Cet accord marque une expansion significative du partenariat de longue date entre les deux entreprises, à l’heure où Meta travaille au développement de la prochaine génération de son IA. Le déploiement commencera avec des dizaines de millions de cœurs Graviton, et pourra être étendu à mesure que les capacités d’IA de Meta se développeront. Cet accord marque une évolution dans la manière...

-
Andersen Global zwiększa obecność w Afryce wraz z otwarciem firmy członkowskiej w Kamerunie
SAN FRANCISCO--(BUSINESS WIRE)--Rusza działalność Andersen Global w Kamerunie – firma Phoenix Advisory obejmuje status firmy członkowskiej i przyjmuje szyld Andersen. Andersen in Cameroon to wyspecjalizowana firma doradcza świadcząca strategiczne usługi doradztwa biznesowego, finansowego i operacyjnego na rzecz organizacji znajdujących się w różnych stadiach rozwoju. Firma, założona przez specjalistów, którzy zdobyli doświadczenie w dużych międzynarodowych organizacjach, łączy solidną wiedzę na...
-
Meta assina acordo com AWS para impulsionar Agentic AI em chips AWS Graviton
SEATTLE--(BUSINESS WIRE)--A Meta assinou um acordo para implementar processadores AWS Graviton em escala. O acordo marca uma expansão significativa de uma parceria de longa data entre as duas empresas, enquanto a Meta constrói sua próxima geração de IA. A implementação começa com dezenas de milhões de núcleos Graviton, com a flexibilidade para expansão à medida que os recursos de IA da Meta crescem. O acordo reflete uma mudança na forma como a infraestrutura de IA é construída: embora as GPUs c...
-
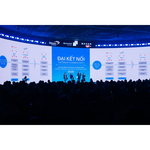
“The Great Connectivity” – How Masan Group Creates Value for Consumers, Partners, and Shareholders
HO CHI MINH CITY, Vietnam--(BUSINESS WIRE)--Masan unveils cOS strategy at 2026 AGM, integrating retail, brands, and digital to drive growth, efficiency, and consumer value in Vietnam’s market....
-
NASDAQ: SRAD Investigation Alert: Kessler Topaz Meltzer & Check, LLP Encourages Sportradar Group AG (NASDAQ: SRAD) Investors to Contact the Firm
RADNOR, Pa.--(BUSINESS WIRE)--Kessler Topaz Meltzer & Check, LLP (www.ktmc.com), a nationally recognized securities litigation law firm, is investigating potential violations of the federal securities laws by Sportradar Group AG (Sportradar) (NASDAQ: SRAD) on behalf of investors who purchased or acquired SRAD securities and experienced significant financial losses. Sportradar’s Alleged Illegal Gambling Involvement On April 22, 2026, Muddy Waters Research released a report alleging, among ot...
-
Factorial Names Dr. Dieter Zetsche to Board of Directors, Bringing World-Class Leadership to Its Commercial Scale and Public Market Journey
BOSTON--(BUSINESS WIRE)--Factorial Inc. (“Factorial”), a leader in solid-state battery technology, today announced that, upon the closing of the previously announced business combination with Cartesian Growth Corporation III (Nasdaq: CGCT), Dr. Dieter Zetsche will be appointed to the Board of Directors of the combined company (the “Board”). Having served as an early investor and trusted advisor to the company since 2021, Dr. Zetsche's transition to the Board marks a natural and significant step...

-
The Estée Lauder Companies to Webcast Discussion of Fiscal 2026 Third Quarter Results on May 1, 2026
NEW YORK--(BUSINESS WIRE)--The Estée Lauder Companies Inc. (NYSE: EL) will release its fiscal 2026 third quarter results on Friday, May 1, 2026. On that date, at 8:30 a.m. (ET), the Company will provide a live webcast of its conference call and presentation discussing the results, future prospects and recent corporate developments. Stéphane de La Faverie, President and CEO, and Akhil Shrivastava, EVP and CFO, will host the call. Those wishing to access the webcast can visit http://www.elcompani...

-
Investor Notice: Robbins LLP Informs Investors of the LKQ Corporation Class Action
SAN DIEGO--(BUSINESS WIRE)--Robbins LLP informs stockholders that a class action was filed on behalf of all investors who purchased or otherwise acquired LKQ Corporation (NASDAQ: LKQ) common stock between February 27, 2023 and July 23, 2025. LKQ is a global distributor of alternative collision replacement parts, recycled engines, and other vehicle components for the repair of automobiles. For more information, submit a form, email attorney Aaron Dumas, Jr., or give us a call at (800) 350-6003....