

Newsroom
Sorted by: Latest
-
ATS Announces Dates of First Quarter Results Conference Call and Annual Meeting of Shareholders
CAMBRIDGE, Ontario--(BUSINESS WIRE)--ATS Corporation (TSX: ATS) (NYSE: ATS) (“ATS” or the “Company”) will report its financial results for the first quarter ended June 28, 2026, before markets open on Thursday August 06, 2026. At 8:30 a.m. Eastern on August 06, 2026, the Company will host a conference call and webcast of management's quarterly remarks and follow up question and answer period with analysts. The listen-only webcast can be accessed at https://events.q4inc.com/attendee/766230709 an...
-
Securities Fraud Investigation Into GE HealthCare Technologies Inc. (GEHC) Continues – Shareholders Who Lost Money Urged To Contact The Law Offices of Frank R. Cruz
LOS ANGELES--(BUSINESS WIRE)--The Law Offices of Frank R. Cruz continues its investigation of GE HealthCare Technologies Inc. (“GE HealthCare” or the “Company”) (NASDAQ: GEHC) on behalf of investors concerning the Company’s possible violations of federal securities laws.IF YOU ARE AN INVESTOR WHO LOST MONEY ON GE HEALTHCARE TECHNOLOGIES INC. (GEHC), CLICK HERE TO INQUIRE ABOUT POTENTIALLY PURSUING A CLAIM TO RECOVER YOUR LOSS.What Is The Investigation About?On April 29, 2026, GE HealthCare repor...
-
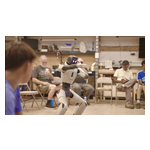
Faraday Future Highlights Its EAI Robotics at Maker Faire Meetups, Advancing EAI Robot Co-Creation and Developer Ecosystem Growth
LOS ANGELES--(BUSINESS WIRE)--Faraday Future Intelligent Electric Inc. (NASDAQ: FFAI) (“Faraday Future,” “FF,” or the “Company”), a California-based global Embodied AI (“EAI”) ecosystem company, participated in a recent Maker Faire community meetup that occurred in Orange County, CA this month. FF showcased its newest robotics products designed for education, security, and other market applications. FF presented its FF Master robot, along with its open-source and open developer platform, to an a...
-
Sensient Declares Dividend
MILWAUKEE--(BUSINESS WIRE)--The Board of Directors of Sensient Technologies Corporation (NYSE: SXT) has declared a regular quarterly cash dividend on its common stock of $0.41 per share. The cash dividend will be paid on September 1, 2026, to shareholders of record on August 3, 2026. About Sensient Technologies Sensient Technologies Corporation is a leading global manufacturer and marketer of colors, flavors, and other specialty ingredients. Sensient uses advanced technologies and robust global...
-
AHF à la Conférence sur le sida 2026 : le sida n'est pas terminé, et la syphilis est en hausse
RIO DE JANEIRO--(BUSINESS WIRE)--En tant que leader mondial dans la prévention et le traitement du VIH et des IST, AIDS Healthcare Foundation (AHF) apporte une fois de plus un message audacieux et provocateur à la 26e Conférence internationale sur le sida (AIDS 2026) à Rio de Janeiro, au Brésil, qui se tient en personne et virtuellement du 26 au 31 juillet. Le risque et l'urgence de la montée en flèche des taux de syphilis seront au centre du stand d'AHF pour rappeler à tout le monde l'importan...
-
AHF en la Conferencia “AIDS 2026”: El SIDA no ha terminado, y la sífilis va en aumento
RÍO DE JANEIRO--(BUSINESS WIRE)--En su condición de líder mundial en la prevención y el tratamiento del VIH y las ITS, la AIDS Healthcare Foundation (AHF) vuelve con un mensaje audaz y desafiante a la 26.ª Conferencia Internacional sobre el SIDA (AIDS 2026) en Río de Janeiro, Brasil, que se llevará a cabo de manera presencial y virtual del 26 al 31 de julio. El riesgo y la urgencia que representan las tasas de sífilis en aumento vertiginoso serán el tema central en el stand de AHF en la confere...
-
AHF na Conferência AIDS 2026: a AIDS ainda não acabou — e a sífilis está em alta
RIO DE JANEIRO--(BUSINESS WIRE)--Líder global em prevenção e tratamento do HIV e de ISTs, a AIDS Healthcare Foundation (AHF) traz mais uma vez uma mensagem ousada e provocativa para a 26ª Conferência Internacional sobre AIDS (AIDS 2026), que será realizada presencialmente e virtualmente de 26 a 31 de julho no Rio de Janeiro, Brasil. O estande da AHF na conferência destacará o risco e a urgência do aumento vertiginoso das taxas de sífilis, lembrando a todos da importância de exames regulares par...
-
Riassunto: Gurobi pubblica il primo State of Mathematical Optimization in Academia Report
BEAVERTON, Ore.--(BUSINESS WIRE)--Gurobi Optimization, LLC, leader nel settore della tecnologia di intelligence decisionale, ha annunciato oggi la pubblicazione del suo primo State of Mathematical Optimization in Academia Report (Rapporto sullo stato dell'ottimizzazione matematica nel mondo accademico). Basandosi su sondaggi condotti tra più di 1.180 docenti e studenti che utilizzano attivamente Gurobi, il rapporto esamina come l'ottimizzazione venga insegnata, utilizzata nella ricerca e applic...
-
UNITE HERE Local 11 Sues State Prisons for Withholding Information About Embattled Prison Food Service Contractor Aramark
PHOENIX--(BUSINESS WIRE)--UNITE HERE Local 11, a union representing thousands of Arizona food service workers, filed a lawsuit in state court last Friday against the Arizona prison system for allegedly declining to disclose information about prison food service and the performance of the prison chief food service contractor, Aramark. Aramark is a major contractor for state facilities in Arizona, including ASU and the Phoenix Convention Center. Despite generating nearly $18.5 billion in revenues...

-
PowerTransitions Completes Acquisition of Five New York Plants, Expanding New York Portfolio
HOUSTON--(BUSINESS WIRE)--PowerTransitions acquires New York power assets....