

Newsroom
Sorted by: Latest
-
AM Best Affirms Credit Ratings of Clearbrook Group Holdings, Inc. and Subsidiaries
OLDWICK, N.J.--(BUSINESS WIRE)--AM Best has affirmed the Financial Strength Rating (FSR) of A- (Excellent) and the Long-Term Issuer Credit Ratings (Long-Term ICR) of “a-” (Excellent) of the members of Argo Group (Argo) (New York, NY). Concurrently, AM Best has affirmed the FSR of A (Excellent) and the Long-Term ICRs of “a” (Excellent) of American National Property and Casualty Company (Lincoln, NE) and its affiliates and subsidiaries, which are collectively referred to as the Farm Family Insura...
-
Riassunto: La nuova World ID: ls prova di essere umani per l'era dell'IA cresce nelle piattaforme digitali utilizzate ogni giorno da persone e aziende
SAN FRANCISCO--(BUSINESS WIRE)--La settimana scorsa, World ha annunciato la nuova generazione di World ID, la sua evidenza del protocollo umano, progettata per aumentare la fiducia su internet. L'iniziativa è stata annunciata durante “Lift Off”, un evento live a San Francisco. Mentre l'intelligenza artificiale facilita più che mai la generazione di contenuti, identità e interazioni convincenti, la fiducia online è diminuita. World ID affronta questa sfida consentendo alle persone di provare pri...

-
Le nouveau World ID : une preuve d’identité humaine pour l’ère de l’IA, déployée sur toutes les plateformes numériques utilisées quotidiennement par les particuliers et les entreprises
SAN FRANCISCO--(BUSINESS WIRE)--La semaine dernière, World a annoncé la nouvelle génération de World ID, son protocole de preuve d’humanité, conçu pour renforcer la confiance sur Internet. Cette annonce a été faite lors de « Lift Off » , un événement en direct à San Francisco. Alors que l’IA permet plus facilement que jamais de générer du contenu, des identités et des interactions convaincants, la confiance en ligne a diminué. World ID relève ce défi en permettant aux individus de prouver en to...

-
Neue World ID: der Nachweis der Menschlichkeit für das Zeitalter der KI dehnt sich auf die digitalen Plattformen aus, die Menschen und Unternehmen jeden Tag nutzen
SAN FRANCISCO--(BUSINESS WIRE)--Letzte Woche kündigte World die nächste Generation von World ID an, sein Protokoll für den Nachweis der Menschlichkeit zur Stärkung des Vertrauens im Internet. Die Bekanntgabe wurde während „Lift Off“, einem Live-Event in San Francisco gemacht. Da es KI einfacher denn je macht, überzeugende Inhalte, Identitäten und Interaktionen zu erstellen, ist das Vertrauen im Internet gesunken. World ID begegnet dieser Herausforderung, indem es Einzelpersonen ermöglicht, priv...

-
Samenvatting: De New World ID: een identiteitsbewijs voor het AI-tijdperk, beschikbaar op alle digitale platforms die mensen en bedrijven dagelijks gebruiken
SAN FRANCISCO--(BUSINESS WIRE)--Vorige week kondigde World de volgende generatie van World ID aan. Dit is een protocol om te bewijzen dat je een mens bent, bedoeld om het vertrouwen op het internet te vergroten. De aankondiging vond plaats tijdens "Lift Off ", een live-evenement in San Francisco. Nu AI het gemakkelijker dan ooit maakt om overtuigende content, identiteiten en interacties te genereren, is het vertrouwen online afgenomen. World ID pakt deze uitdaging aan door individuen in staat t...

-
Business Litigator Alex Brauer Honored Among Dallas’ Best Lawyers
DALLAS--(BUSINESS WIRE)--Trial lawyer Alex Brauer, co-founder of the litigation boutique Bailey Brauer PLLC, has been named for an 11th consecutive year to D Magazine’s Best Lawyers in Dallas list. Mr. Brauer is one of Dallas’ most sought-after lawyers for helping clients resolve business disputes through trial, mediation or other settlement options. He handles controversies relating to the sale and purchases of companies, allegations of fraud, deceptive practices, and breaches of fiduciary dut...
-
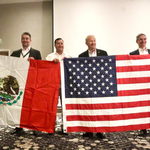
Samenvatting: Pacífico Mexinol viert de symbolische eerste stap in Topolobampo en positioneert Mexico in de nieuwe koolstofarme chemische industrie
TOPOLOBAMPO, Mexico--(BUSINESS WIRE)--Het Pacifico Mexinol-project ("Mexinol") vierde de start van de voorbereidende bouwfase met een symbolische eerste steenlegging. Hiermee werd het startschot gegeven voor een van de belangrijkste wereldwijde industriële investeringen in blauwe en ultrakoolstofarme methanol. Het evenement bracht diplomaten, overheidsfunctionarissen en nationale en internationale bedrijfsleiders bijeen, wat het strategische belang van het project voor Mexico en de integratie e...
-
GATX Corporation Announces Quarterly Dividend
CHICAGO--(BUSINESS WIRE)--The board of directors of GATX Corporation (NYSE: GATX) today declared a quarterly dividend of $0.66 per common share, payable June 30, 2026, to shareholders of record on June 15, 2026. This quarterly dividend is unchanged from the prior quarter. COMPANY DESCRIPTION At GATX Corporation (NYSE: GATX), we empower our customers to propel the world forward. GATX leases transportation assets including railcars, aircraft spare engines and tank containers to customers worldwid...
-
Securities Fraud Investigation Into Calix, Inc. (CALX) Announced – Shareholders Who Lost Money Urged To Contact Glancy Prongay Wolke & Rotter LLP, a Leading Securities Fraud Law Firm
LOS ANGELES--(BUSINESS WIRE)--Glancy Prongay Wolke & Rotter LLP, a leading national shareholder rights law firm, today announced that it has commenced an investigation on behalf of Calix, Inc. (“CALX” or the “Company”) (NYSE: CALX) investors concerning the Company’s possible violations of the federal securities laws. IF YOU ARE AN INVESTOR WHO LOST MONEY ON CALIX, INC. (CALX), CLICK HERE TO INQUIRE ABOUT POTENTIALLY PURSUING CLAIMS TO RECOVER YOUR LOSS. What Happened? On April 21, 2026, Cal...
-
Mineros S.A. Leads Construction of New Public School in Colombia’s Bajo Cauca Region, Advancing Social Investment In Nechí Operations
MEDELLÍN, Colombia--(BUSINESS WIRE)--Mineros S.A. (TSX: MSA | OTCQX: MNSAF | BVC: MINEROS) (“Mineros” or the “Company”) today announced the groundbreaking of a new public secondary school — Institución Educativa El Bagre — in the municipality of El Bagre, Antioquia, located within the Company’s Nechí Alluvial Property operating footprint in the Bajo Cauca region of Colombia. Management Commentary “Investing in education in the communities where we operate is fundamental to how we understand res...