

Newsroom
Sorted by: Latest
-
ORCL Investors Have Opportunity to Join Oracle Corporation Fraud Investigation with the Schall Law Firm
LOS ANGELES--(BUSINESS WIRE)--ORCL Investors Have Opportunity to Join Oracle Corporation Fraud Investigation with the Schall Law Firm...
-
FPT Recognized in Everest Group Banking IT Services PEAK Matrix® Assessment 2025
HANOI, Vietnam--(BUSINESS WIRE)--Global IT services provider FPT has been positioned as a Major Contender in the Everest Group Banking IT Services PEAK Matrix® Assessment 2025, marking its first appearance in this industry benchmark. The research evaluates 41 providers for the banking IT services. Providers are grouped into Leaders, Major Contenders, Aspirants, and Star Performers based on their ability to support modernization, adopt agentic AI in a responsible and scalable way, and help banks...
-
Riassunto: Alpaca raccoglie 150 milioni di dollari a una valutazione di 1,15 miliardi di dollari per costruire lo standard globale delle infrastrutture di mediazione
SAN MATEO, Calif.--(BUSINESS WIRE)--Alpaca, un leader globale nelle infrastrutture di mediazione, le cui API alimentano aziende partner come Kraken, SBI Securities e Dime!, oggi hanno annunciato di aver raccolto 150 milioni di dollari in un round di finanziamento di serie D condotto da Drive Capital che valuta la società a 1,15 miliardi di dollari. Il cofondatore e socio di Drive Capital, Chris Olsen, si unirà al CdA di Alpaca come previsto dall'investimento. La società si è inoltre assicurata...

-
Alpaca完成1.5亿美元融资,估值达11.5亿美元,致力于打造经纪商基础设施全球标杆
加州圣马特奥--(BUSINESS WIRE)--(美国商业资讯)-- Alpaca是一家全球经纪商基础设施领军企业,其API为Kraken、SBI Securities和Dime!等合作伙伴提供支持。公司今日宣布完成1.5亿美元D轮融资,本轮融资由Drive Capital领投,公司估值达11.5亿美元。作为投资协议的一部分,Drive Capital联合创始人兼合伙人Chris Olsen将加入Alpaca董事会。此外,公司还获得4000万美元的信贷额度,进一步增强了其资产负债表,助力其持续拓展全球业务。 Alpaca联合创始人兼首席执行官Yoshi Yokokawa表示:“我们的使命是向全球每个人开放金融服务。我们正在打造经纪商基础设施的全球标杆,让合作伙伴能够将投资服务带给更多人。此次融资将为我们提供助力,以更快地为全球企业合作伙伴和活跃交易者推出更多优质服务。” 凭借可扩展的API和自清算托管服务,Alpaca使用户能够在全球范围内交易股票、交易所交易基金(ETF)、期权、加密货币和固定收益产品。目前,Alpaca已在40多个国家与超过300家机构建立合作关系,为领先金融机构...
-
Alpaca完成1.5億美元融資,估值達11.5億美元,致力於打造經紀商基礎設施全球標竿
加州聖馬提歐--(BUSINESS WIRE)--(美國商業資訊)-- Alpaca是一家全球經紀商基礎設施領軍企業,其API為Kraken、SBI Securities和Dime!等合作夥伴提供支援。公司今日宣布完成1.5億美元D輪融資,本輪融資由Drive Capital領投,公司估值達11.5億美元。根據投資協議,Drive Capital共同創辦人兼合夥人Chris Olsen將加入Alpaca董事會。此外,公司還獲得4000萬美元的授信額度,進一步強化其資產負債表,協助其持續擴大全球業務。 Alpaca共同創辦人兼執行長Yoshi Yokokawa表示:「我們的使命是向全球每個人開放金融服務。我們正在打造經紀商基礎設施的全球標竿,讓合作夥伴能夠將投資服務帶給更多人。此次融資將為我們提供動力,以更快地為全球企業合作夥伴和活躍交易者推出更多優質服務。」 憑藉可擴充的API和自清算代管服務,Alpaca讓使用者能夠在全球交易股票、交易所買賣基金(ETF)、選擇權、加密貨幣和固定收益產品。目前,Alpaca已在40多個國家與超過300家機構建立合作關係,為一流金融機構和金融科技公司的...

-
H2O.ai Accredited by IMDA Singapore for Enterprise Generative AI Solutions
SINGAPORE--(BUSINESS WIRE)--H2O.ai, a pioneer in sovereign AI and the world’s leading agentic and predictive AI company, today announced its latest renewal under Singapore’s Infocomm Media Development Authority (IMDA)’s Accreditation programme for its cutting-edge Enterprise GenAI product suite. This recognition underscores H2O.ai’s commitment to delivering secure, responsible, and enterprise-grade AI solutions for Singapore’s public and private sectors, as organizations increasingly seek air-g...
-
KBRA Assigns Preliminary Ratings to PEAC Solutions Receivables 2026-1 LLC
NEW YORK--(BUSINESS WIRE)--KBRA assigns preliminary ratings to five classes of notes issued by PEAC Solutions Receivables 2026-1 (PEAC 2026-1), an equipment ABS transaction. PEAC 2026-1 will issue five classes of notes, including a short-term tranche. Credit enhancement includes excess spread, a reserve account, overcollateralization and subordination (except for Class C Notes). The overcollateralization is subject to a target equal to 19.80% of the current ASV and a floor equal to 1.00% of the...
-
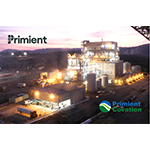
プリミエント、プリミエント・コベーションの完全所有権を取得
イリノイ州シャンバーグ--(BUSINESS WIRE)--(ビジネスワイヤ) -- バイオ製造分野の世界的リーダー企業であるプリミエントは、プリミエント・コベーションLLC(以下、プリミエント・コベーション」)の残存する所有権の取得に合意したことを発表しました。これにより、プリミエントは同社の単独所有企業となり、バイオエコノミーにおける同社の成長において新たな章を開くことになります。 この買収は、バイオ製造分野でのプリミエントのリーダーシップ強化戦略の次なるステップであり、Sustaineaとの提携やiPROOF事業の立ち上げなど、最近の発表を基盤としたものです。プリミエント・コベーションは、米国のバイオ製造業界をリードする存在であり、バイオ製造と発酵技術における幅広い専門知識で高い評価を得ています。2000年に設立され、Zemea®およびSusterra®ブランドのもと、化粧品やパーソナル・ケア、繊維、ファッション、塗装、機能性流体などの用途を含む多様なエンド・マーケット向けに、Bio-PDO(1,3-プロパンジオール)を供給しています。プリミエント・コベーションは、世界中にバイ...
-
Alpaca capta US$ 150 milhões com avaliação de US$ 1,15 bilhão para construir o padrão global de infraestrutura de corretagem
SAN MATEO, Califórnia--(BUSINESS WIRE)--A Alpaca, líder global em infraestrutura de corretagem cujas APIs capacitam parceiros como Kraken, SBI Securities e Dime!, anunciou hoje a captação de US$ 150 milhões em uma rodada Série D, liderada pela Drive Capital, que avalia a empresa em US$ 1,15 bilhão. Como parte do investimento, Chris Olsen, cofundador e sócio da Drive Capital, passará a integrar o Conselho de Administração da Alpaca. A empresa também garantiu uma linha de crédito de US$ 40 milhõe...

-
KKR Completes US$2.5 Billion Asia Private Credit Fundraise
HONG KONG--(BUSINESS WIRE)--KKR Completes US$2.5 Billion Asia Private Credit Fundraise...