Newsroom
Sorted by: Latest
-
National Association for Veterans Rights Raises Questions About Federal Court Ruling Impacting Veteran Claims Assistance
WASHINGTON--(BUSINESS WIRE)--The National Association for Veterans Rights (NAVR) today responded to the recent district court ruling in Ford v. Veterans Guardian, warning that the decision could significantly disrupt access to lawful assistance for Veterans navigating the VA disability claims process. While the ruling addresses a threshold legal issue and is not a final determination of liability, NAVR believes the Court adopted an overly broad interpretation of federal law, creating substantia...
-
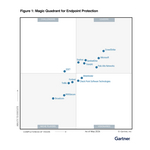
CrowdStrike Named a Leader in the 2026 Gartner® Magic Quadrant™ for Endpoint Protection for Seventh Consecutive Time
AUSTIN, Texas--(BUSINESS WIRE)--CrowdStrike (NASDAQ: CRWD) today announced it has been named a Leader in the 2026 Gartner® Magic Quadrant™ for Endpoint Protection1 for the seventh consecutive time. CrowdStrike was also positioned furthest right for Completeness of Vision and highest for Ability to Execute among all vendors evaluated for the fourth time in a row. CrowdStrike pioneered AI-native endpoint security and is defining the future of AI Detection and Response. AI has triggered an endpoin...
-
AM Best Affirms Credit Ratings of Halyk-Life, JSC
LONDON--(BUSINESS WIRE)--AM Best has affirmed the Financial Strength Rating of B++ (Good) and the Long-Term Issuer Credit Rating of “bbb” (Good) of Halyk-Life, Life Insurance Subsidiary Company of the Halyk Bank of Kazakhstan, JSC (Halyk-Life) (Kazakhstan). The outlook of these Credit Ratings (ratings) is stable. The ratings reflect Halyk-Life’s balance sheet strength, which AM Best assesses as very strong, as well as its strong operating performance, limited business profile and marginal enter...
-
Rio Tinto commissions $1.5 billion AP60 smelter expansion in Quebec
SAGUENAY, Canada--(BUSINESS WIRE)--Rio Tinto has successfully started commissioning its US$1.5 billion AP60 smelter expansion at Complexe Arvida in Quebec, marking a major milestone for the deployment of its state-of-the-art, low-carbon aluminium smelting technology. The start-up, which began in March, is expected to be completed by the end of 2026 with all 96 new pots operating. This will increase the plant’s production capacity by approximately 160,000 metric tonnes of primary aluminium annua...

-
Rio Tinto met en service son agrandissement de 1,5 milliard de dollars pour l’aluminerie AP60 au Québec
SAGUENAY, Canada--(BUSINESS WIRE)--Rio Tinto a amorcé la mise en service de l’agrandissement de l’aluminerie AP60 au Complexe Arvida, au Québec, un projet de 1,5 milliard de dollars américains (2 milliards de dollars canadiens) qui marque une étape majeure dans le déploiement de sa technologie de pointe de production d’aluminium à faible empreinte carbone. Le démarrage, amorcé en mars, devrait être complété d’ici la fin de 2026, lorsque les 96 nouvelles cuves seront toutes en opération. Cette e...

-
AM Best Affirms Credit Ratings of Euro Accident Livförsäkring AB
AMSTERDAM--(BUSINESS WIRE)--AM Best has affirmed the Financial Strength Rating of A- (Excellent) and the Long-Term Issuer Credit Rating of “a-” (Excellent) of Euro Accident Livförsäkring AB (Euro Accident) (Sweden). The outlook of these Credit Ratings (ratings) is stable. The ultimate parent of Euro Accident is Impilo AB, a Swedish investment firm focused on Nordic healthcare investments. The ratings reflect Euro Accident’s balance sheet strength, which AM Best assesses as strong, as well as it...
-
Top Middle Market Companies in OC and IE Go Gold at 2026 ACG Awards Gala
IRVINE, Calif.--(BUSINESS WIRE)--ACG Orange County honors region’s highest performing middle market companies at 2026 ACG Awards gala....

-
UBS Announces Leadership Appointments in the Southeast US Region
NEW YORK--(BUSINESS WIRE)--UBS Wealth Management USA today announced two leadership appointments in its Southeast Wealth Management Region. The Southeast Region, which has seen an influx of wealth in recent years, encompasses some of the nation’s fastest growing wealth centers, including Philadelphia, Washington, D.C., Charlotte, Charleston, Nashville, Atlanta, Miami, Palm Beach, Naples and Tampa, among others. John Houlihan has been named Market Executive for the South Market. He is responsibl...
-
AM Best Affirms Credit Ratings of AmTrust Assicurazioni S.p.A.
AMSTERDAM--(BUSINESS WIRE)--AM Best has affirmed the Financial Strength Rating of A- (Excellent) and the Long-Term Issuer Credit Rating of “a-” (Excellent) of AmTrust Assicurazioni S.p.A. (AmTrust Assicurazioni) (Italy). The outlook of these Credit Ratings (ratings) is stable. The ratings reflect AmTrust Assicurazioni’s balance sheet strength, which AM Best assesses as very strong, as well as its adequate operating performance, limited business profile and appropriate enterprise risk management...
-
Logistica: Gerace Trasporti ottiene le certificazioni ISO 9001 e ISO 45001 e l’assessment ECOVADIS
POLISTENA, Italia--(BUSINESS WIRE)--Gerace Trasporti, azienda specializzata in logistica e autotrasporti con sede a Polistena e Cittanova (Reggio Calabria), ha consolidato recentemente il suo know how. L’11 febbraio 2026 ha infatti ottenuto le certificazioni ISO 9001, ISO 45001 e dell’assessment EcoVadis. Un traguardo che rappresenta un ulteriore passaggio importante nel percorso di strutturazione aziendale che è stato avviato con l’obiettivo di migliorare standard qualitativi, sicurezza operat...