Newsroom
Sorted by: Latest
-
Shareholder Alert - Robbins LLP Informs Investors of the Bloom Energy Corporation Class Action Lawsuit
SAN DIEGO--(BUSINESS WIRE)--Robbins LLP informs investors that a securities class action has been filed on behalf of all persons and entities that purchased or otherwise acquired Bloom Energy Corporation (NYSE: BE) securities between February 27, 2025 and July 8, 2026 (the "Class Period").Bloom Energy designs, manufactures, sells, and installs solid oxide fuel cell systems for on-site power generation in the United States and internationally. Scandium is a rare earth metal used as a dopant to st...
-
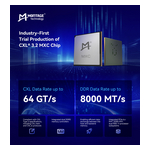
瀾起科技率先試製CXL® 3.2記憶體擴充控制器
廣東橫琴--(BUSINESS WIRE)--(美國商業資訊)-- 瀾起科技今日宣布,率先在業界試製CXL® 3.2記憶體擴充控制器(MXC)晶片。該產品針對人工智慧、雲端運算、資料中心等場景的記憶體擴充與資源池化需求,旨在透過CXL技術協助客戶建構更高容量、更高利用率、更加靈活的記憶體基礎架構。 瀾起科技的CXL 3.2記憶體擴充控制器支援CXL Type 3規格的CXL.mem和CXL.io協議,以PCIe® 6.x和CXL 3.2協議為基礎設計,最高支援64 GT/s資料傳輸速率。產品整合雙DDR5記憶體控制器,可支援最高8000 MT/s的 DDR5記憶體,透過將主機側CXL記憶體請求即時轉換為DDR存取指令,實現主機與後端記憶體間的高效資料互動,從而突破傳統伺服器的記憶體容量限制。 此外,該晶片整合了PCIe 6.x PHY、DDR5 PHY、雙 RISC-V處理器子系統及豐富的管理介面,可支援開發PCIe標準插卡(AIC)、EDSFF等多種型式的CXL記憶體擴充產品,為記憶體擴充、記憶體池化和分層記憶體架構等新型記憶體應用提供關鍵支撐。 瀾起科技總裁Stephen Tai先...
-
UNITE HERE Local 11 Releases Letter Urging Greene County Ohio Board of Commissioners and Captain Tony Buschur to Consider Aramark’s Problematic Track Record in Prison Food Service and Award Contract to Alternate Provider
PHOENIX--(BUSINESS WIRE)--UNITE HERE Local 11 urges Greene County, Ohio to consider Aramark’s track record in prison food service and award the contract to another provider....

-
BE CLASS ACTION NOTICE: Glancy Prongay Wolke & Rotter LLP Files Securities Fraud Lawsuit On Behalf Of Bloom Energy Corporation Investors
LOS ANGELES--(BUSINESS WIRE)--GPWR files securities fraud class action on behalf of BE investors. Contact firm before 9/28/26....
-
Dream expande su plataforma de gestión de activos con la adquisición de Chancerygate, uno de los principales gestores y promotores de activos industriales del Reino Unido
TORONTO y LONDRES--(BUSINESS WIRE)--Dream Unlimited Corp. ("Dream") (TSX: DRM) anunció hoy que Dream y Dream Industrial Real Estate Investment Trust ("Dream Industrial REIT") (TSX: DIR.UN), han firmado los acuerdos definitivos para que Dream adquiera Chancerygate Limited ("Chancerygate" o " CG"), un promotor y gestor de activos industriales con sede en el Reino Unido que cuenta con una trayectoria de 30 años en el sector de los inmuebles industriales multiarrendatarios (MLI). Actualmente, Chanc...
-
CAPR CLASS ACTION NOTICE: Glancy Prongay Wolke & Rotter LLP Files Securities Fraud Lawsuit on Behalf of Capricor Therapeutics, Inc.
LOS ANGELES--(BUSINESS WIRE)--GPWR files securities fraud class action on behalf of CAPR investors. Contact firm before 9/28/26....
-
FCPT Announces Sale-Leaseback of a Sun Auto Tire & Service Property for $2.5 Million
MILL VALLEY, Calif.--(BUSINESS WIRE)--Four Corners Property Trust (NYSE:FCPT), a real estate investment trust primarily engaged in the ownership and acquisition of high-quality, net-leased restaurant and retail properties (“FCPT” or the “Company”), is pleased to announce the acquisition of a Sun Auto Tire & Service property for $2.5 million via sale-leaseback. The property is located in a highly trafficked corridor in North Carolina and corporate-operated under a long-term, triple net lease...
-
Mary Kay publie son Rapport de développement durable 2026, qui met en avant des progrès transformateurs à l’échelle mondiale en matière d’impact social, économique et environnemental
DALLAS--(BUSINESS WIRE)--Mary Kay Inc., une entreprise de produits de beauté de premier plan à l’échelle mondiale engagée en faveur du développement durable et de l’émancipation des femmes, a annoncé aujourd’hui la publication de son Rapport sur le développement durable 2026 (2026 Sustainability Report). Ce rapport présente les progrès accomplis par la société envers ses objectifs pour 2030, célèbre les réalisations de 2025 et met en lumière les dernières avancées qui continuent de générer un i...

-
Mary Kay presenta il Rapporto sulla sostenibilità 2026, evidenziando i progressi trasformativi realizzati a livello globale nelle sfere sociale, economica e ambientale
DALLAS--(BUSINESS WIRE)--Mary Kay Inc., azienda leader globale nel settore della cosmesi, impegnata nella sostenibilità e dell'emancipazione femminile, oggi ha presentato il suo Rapporto sulla sostenibilità 2026, una panoramica dei traguardi compiuti per raggiungere i suoi obiettivi per il 2030 e una celebrazione del 2025 e degli ultimi successi dell'azienda che continuano a promuovere il cambiamento positivo a livello mondiale. Il rapporto annuale sottolinea la dedizione pluridecennale di Mary...

-
Rimini Street führt Rimini Govern™ for AI ein, um umfassende Governance, Sicherheit und Interoperabilität für KI-Agenten als Dienstleistung bereitzustellen
LAS VEGAS--(BUSINESS WIRE)--Rimini Street, Inc. (Nasdaq: RMNI), das Unternehmen für Software Support und Agentic AI ERP™ sowie der führende Drittanbieter von Supportleistungen für Oracle-, SAP- und VMware-Software, gab heute die sofortige Verfügbarkeit von Rimini Govern™ for AI bekannt, dem neuesten Angebot im Rimini Govern-Portfolio des Unternehmens für Governance-, Risiko- und Compliance-Lösungen (GRC). Der neue Managed Service wird rund um die Uhr an 365 Tagen im Jahr über die globalen Komma...