Newsroom
Sorted by: Latest
-
Riassunto: Tabelog, il maggior servizio giapponese (*1) di ricerca e prenotazione ristoranti, lancia un'app multilingue dedicata ai visitatori internazionali
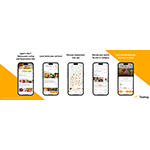
TOKYO--(BUSINESS WIRE)--Tabelog (https://tabelog.com/en/), il maggior servizio di ricerca e prenotazione ristoranti in Giappone gestito da Kakaku.com, Inc., lunedì 17 novembre 2025 ha lanciato la sua app multilingue per smartphone (iOS/Android) dedicata ai viaggiatori di tutto il mondo. Con circa 100 milioni di utenti al mese (*3), Tabelog è leader nipponico nei servizi di ricerca di ristoranti utilizzato quotidianamente dai giapponesi. Il suo database non ha confronti a livello locale e propon...
-
Riassunto: Hanshow e l'Università di Cambridge avviano una ricerca congiunta sulla tecnologia wireless ibrida intelligente potenziata
LONDRA--(BUSINESS WIRE)--Hanshow, leader globale nel settore delle etichette elettroniche per scaffali (ESL) e delle soluzioni digitali per negozi, ha sottoscritto una collaborazione di ricerca pluriennale con l'Università di Cambridge, uno degli istituti accademici più prestigiosi a livello mondiale. La partnership si concentrerà sulla ricerca congiunta e sull'innovazione delle tecnologie wireless ibride intelligenti di prossima generazione, segnando un importante traguardo per l'investimento...
-
Samenvatting: Hanshow en de Universiteit van Cambridge lanceren een gezamenlijk onderzoek naar augmented intelligente hybride draadloze technologie
LONDEN--(BUSINESS WIRE)--Hanshow, een wereldleider in ESL (electronic shelf labels) en digitale winkeloplossingen, is een meerjarige onderzoekssamenwerking aangegaan met de Universiteit van Cambridge, een van de meest prestigieuze academische instellingen ter wereld. Het partnerschap zal zich toeleggen op gezamenlijk onderzoek en innovatie in intelligente hybride draadloze technologieën van de nieuwe generatie. Dit markeert een belangrijke mijlpaal in Hanshows voortdurende investering in kernte...

-
World Liberty Financial’s Stablecoin $USD1 Crosses $3 Billion in Market Capitalization
NEW YORK--(BUSINESS WIRE)--World Liberty Financial (“WLFI”) announced that its flagship digital dollar stablecoin USD1 has, for the first time, eclipsed $3 billion in circulating supply. According to Coinmarketcap.com, USD1 today reached a peak supply of over $3.07 billion. “We launched USD1 because traditional institutions needed a crypto-native but trusted instrument to reap the power of DeFi, but we’ve seen extraordinary demand across the board,” said Zach Witkoff, Co-founder and CEO of Worl...

-
Social Development Bank benadrukt strategische partnerschappen en wereldwijde initiatieven op DeveGo 2025
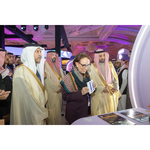
RIYAD, Saoedi-Arabië--(BUSINESS WIRE)--De Social Development Bank (SDB) organiseerde de tweede editie van het Forum voor Ondernemerschap en Moderne Bedrijfspraktijken, 'DeveGo 2025', van 21 tot 23 december in Riyad. Gehouden onder auspiciën van Zijne Excellentie. Ahmed bin Sulaiman Al Rajhi, minister van Human Resources en Sociale Ontwikkeling en voorzitter van de Raad van Bestuur van SDB, brengt het forum regeringsleiders, wereldwijde experts, investeerders en ondernemers samen om de toekomst...

-
La Social Development Bank evidenzia le partnership strategiche e le iniziative globali al DeveGo 2025
RIAD, Arabia Saudita--(BUSINESS WIRE)--Dal 21 al 23 dicembre, la Social Development Bank (SDB) ha ospitato a Riad la seconda edizione del Forum sull'imprenditorialità e le moderne pratiche commerciali, "DeveGo 2025". Organizzato sotto il patrocinio di Sua Eccellenza l'Ing. Ahmed bin Sulaiman Al Rajhi, Ministro delle Risorse Umane e dello Sviluppo Sociale e Presidente del Consiglio di Amministrazione della SDB, il forum riunisce leader governativi, esperti globali, investitori e imprenditori per...
-
DeveGo 2025 : la Banque de Développement Social (SDB) souligne l’importance des partenariats stratégiques et des initiatives internationales
RIYAD, Arabie Saoudite--(BUSINESS WIRE)--La Banque de Développement Social (Social Development Bank - SDB) a organisé la deuxième édition du Forum de l’Entrepreneuriat et des Pratiques Commerciales Modernes « DeveGo 2025 », du 21 au 23 décembre à Riyad. Placé sous le patronage de Son Excellence l’ingénieur Ahmed bin Sulaiman Al Rajhi, ministre des Ressources Humaines et du Développement Social, président du conseil d’administration de la SDB, l’événement a réuni des responsables gouvernementaux...

-
Asia Pacific Mining Industry Review 2025: Production by Country, Major Operating Mines, Major Exploration, and Development Projects - ResearchAndMarkets.com
DUBLIN--(BUSINESS WIRE)--The "Asia Pacific Mining Review 2025" report has been added to ResearchAndMarkets.com's offering. The report contains an overview of the Asia Pacific mining industry including key macroeconomic trends, commodity price, and operating environment across major and emerging mining markets. It provides detailed information on production by country, major operating mines, major exploration, and development projects. Asia Pacific is one of the world's leading mining regions, e...
-
Nintendo Download: Happy Holidays!
REDMOND, Wash.--(BUSINESS WIRE)--This week’s Nintendo Download includes the following content: Digital Spotlight: ’Tis the Season – If you’re looking to spend some quality time with friends and family, why not spread the cheer with some games on the Nintendo Switch 2 and Nintendo Switch systems? Stir up some friendly competition with Super Mario Party Jamboree – Nintendo Switch 2 Edition + Jamboree TV, where the party doesn’t have to stop after the gifts are unwrapped! Or, find out who’s the to...
-
Hanshow and the University of Cambridge Launch Joint Research on Augmented Intelligent Hybrid Wireless Technology
LONDON--(BUSINESS WIRE)--Hanshow, a global leader in electronic shelf labels (ESL) and digital store solutions, has entered into a multi-year research collaboration with the University of Cambridge, one of the world’s most prestigious academic institutions. The partnership will focus on joint research and innovation in next-generation intelligent hybrid wireless technologies, marking an important milestone in Hanshow’s continued investment in core technologies and long-term innovation. This col...