Newsroom
Sorted by: Latest
-
Samenvatting: REJO maakt wereldwijd debuut met modulair apparaat CUBE in Japan
TOKIO--(BUSINESS WIRE)--REJO, een toonaangevende wereldwijde leverancier van Heat-Not-Burn (HNB)-oplossingen, heeft vandaag aangekondigd dat het de REJO CUBE, zijn nieuwste modulaire HNB-apparaat, wereldwijd in Japan introduceert. REJO CUBE breekt met de conventionele ontwerpnormen voor HNB en presenteert een gedurfd nieuw apparaat met een trendy ontwerp en een dubbele inhalatiemodus. Het apparaat is vanaf 16 februari verkrijgbaar via de belangrijkste e-commercekanalen in Japan. Deze bekendmaki...

-
REJO traz dispositivo modular CUBE ao Japão em sua estreia global
TÓQUIO--(BUSINESS WIRE)--A REJO, fornecedora global pioneira de soluções de aquecimento sem combustão (HNB), anunciou hoje o lançamento global do REJO CUBE, seu mais recente dispositivo HNB modular, no Japão. Rompendo com os padrões convencionais de design de dispositivos HNB, o REJO CUBE apresenta uma opção ousada com um visual moderno e uma experiência de inalação em dois modos, chegando aos principais canais de e‑commerce do Japão a partir de 16 de fevereiro. Este lançamento marca a mais rec...
-
Genentech Announces Positive Phase III Results for Gazyva in Primary Membranous Nephropathy, Marking a Significant Milestone in This Autoimmune Disease
SOUTH SAN FRANCISCO, Calif.--(BUSINESS WIRE)--Genentech, a member of the Roche Group (SIX: RO, ROG; OTCQX: RHHBY) announced today that the Phase III MAJESTY study in adults with primary membranous nephropathy met its primary endpoint, showing statistically significant and clinically meaningful results with Gazyva® (obinutuzumab). Results show that significantly more people achieved complete remission at two years (104 weeks) with Gazyva versus tacrolimus. Safety was in line with the well-charac...
-
Galderma Announces Appointment of New Chief Financial Officer
ZUG, Switzerland--(BUSINESS WIRE)--Galderma Group AG (SIX:GALD), the pure-play dermatology category leader, today announced the appointment of Luigi La Corte as Chief Financial Officer (CFO), effective May 1, 2026. Luigi La Corte will join Galderma on April 1 to begin a smooth and orderly transition with Thomas Dittrich, who has served as CFO of Galderma since October 2019. As previously announced, Thomas will remain with the company through Q2 2026 to ensure a seamless transition before pursui...
-
Mitsubishi Electric to Rename Thai Subsidiary Siam Compressor Industry
TOKYO--(BUSINESS WIRE)--Mitsubishi Electric Corporation (TOKYO: 6503) announced today that its Thai subsidiary, Siam Compressor Industry Co., Ltd., which develops, manufactures and sells compressors for air conditioning and refrigeration equipment, will change its name to Mitsubishi Electric Siam Compressor Industry Co., Ltd. effective April 1. In addition to supplying Mitsubishi Electric group companies, Siam Compressor Industry provides a wide range of compressors to other air conditioning eq...
-
REJO lleva el dispositivo modular CUBE a Japón en su estreno mundial
TOKIO--(BUSINESS WIRE)--REJO, un proveedor mundial pionero de soluciones de calor sin combustión (HNB), anunció hoy el debut mundial de REJO CUBE, su último dispositivo HNB modular, en Japón. Rompiendo con las normas de diseño convencionales de HNB, REJO CUBE presenta una nueva y audaz opción de dispositivo con un diseño moderno y una experiencia de inhalación de modo dual, que se lanzará en los principales canales minoristas de comercio electrónico de Japón a partir del 16 de febrero. Este lan...

-
Esslinger debütiert in Deutschland: Die Vexel-Serie als Plattform für ein modulares ergonomisches Arbeitsplatzsystem
BERLIN--(BUSINESS WIRE)--Esslinger gibt heute sein Public-Media-Debüt in Deutschland bekannt und startet am 15. Februar den exklusiven Online-Verkauf der Vexel-Serie über Esslingerlife.de. Die Marke richtet sich an Programmierer und intensive Bildschirmnutzer und versteht den höhenverstellbaren Schreibtisch (Sitz-Steh-Schreibtisch) nicht als Möbelstück, sondern als modulares ergonomisches Arbeitsplatzsystem: Der Tisch ist die Plattform, das Zubehör-Ökosystem (Schreibtischzubehör) der Kern der L...

-
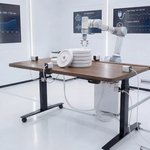
Esslinger Debuts in Germany: Vexel Sit-Stand Desk Series as a Platform for a Modular Ergonomic Workstation Ecosystem
BERLIN--(BUSINESS WIRE)--Esslinger today announced its public-media debut in Germany and the official online launch of its Vexel Series on Esslingerlife.de, starting February 15. Built for programmers and heavy computer users, Esslinger positions the height-adjustable sit-stand desk not as a piece of furniture, but as a modular ergonomic workstation system—where the desk is the platform and the accessory ecosystem is the core solution. Long-session strain rarely comes from one item. It accumula...
-
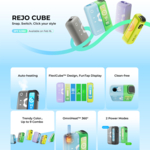
REJO brings CUBE modular device to Japan in its global premiere
TOKYO--(BUSINESS WIRE)--REJO, a pioneering global provider of heat-not-burn (HNB) solutions, today announced the global debut of REJO CUBE, its latest modular HNB device, in Japan. Breaking away from conventional HNB design norms, REJO CUBE introduces a bold new device option featuring a trendy design and dual-mode inhalation experience, launching on Japan’s major e-commerce retail channels from February 16. This launch marks the brand’s latest move following REJO Mate Air’s introduction in Jap...

-
Great Lakes Dredge Investor Alert: Kahn Swick & Foti, LLC Investigates Adequacy of Price and Process in Proposed Sale of Great Lakes Dredge & Dock Corporation - GLDD
NEW YORK & NEW ORLEANS--(BUSINESS WIRE)--Former Attorney General of Louisiana Charles C. Foti, Jr., Esq. and the law firm of Kahn Swick & Foti, LLC (“KSF”) are investigating the proposed sale of Great Lakes Dredge & Dock Corporation (NasdaqGS: GLDD) to Saltchuk Resources, Inc. Under the terms of the proposed transaction, shareholders of Great Lakes will receive $17.00 in cash for each share of Great Lakes that they own. KSF is seeking to determine whether this consideration and the proc...