

Newsroom
Sorted by: Latest
-
PicS N.V. 96 Hour Deadline Alert: Kahn Swick & Foti, LLC Reminds Investors With Losses In Excess Of $100,000 of Deadline in Class Action Lawsuit Against PicS N.V. - PICS
NEW YORK & NEW ORLEANS--(BUSINESS WIRE)--Kahn Swick & Foti, LLC (“KSF”) and KSF partner, the former Attorney General of Louisiana, Charles C. Foti, Jr., remind investors that they have until August 4, 2026 to file lead plaintiff applications in a securities class action lawsuit against PicS N.V. (NasdaqGS: PICS) (“PicS” or the “Company”), if they purchased the Company’s Class A common stock in and/or traceable to its January 30, 2026 initial public offering (the “IPO”). This action is pendin...

-
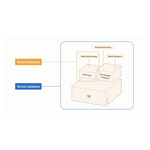
Zilliz Announces Milvus 3.0, Making the World's Most Adopted Open-Source Vector Database Lake-Native
REDWOOD CITY, Calif.--(BUSINESS WIRE)--Zilliz, the company behind Milvus, the world’s most widely adopted open-source vector database, recently announced the release of Milvus 3.0, a major architectural update that brings lake-native data access and a more expressive retrieval engine to developers building production AI applications. Milvus 3.0 enables organizations to build and serve production-grade indexes over vector data that remains in object storage and open data formats. It also moves mo...
-
BrilliA Incorporated Reports Fiscal Year 2026 Financial Results
SINGAPORE--(BUSINESS WIRE)--BrilliA Incorporated (NYSE American: BRIA) (“BrilliA” or the “Company”) today reported financial results for its fiscal year ended March 31, 2026. Fiscal Year 2026 Highlights Return to growth underway in fiscal 2027: Based on preliminary unaudited results for the first quarter ended June 30, 2026, revenue increased approximately 13% year-over-year, and the Company currently expects second-quarter revenue to increase approximately 30% year-over-year. Generated positiv...

-
GeneDx Holdings Corp. 72 Hour Deadline Alert: Kahn Swick & Foti, LLC Reminds Investors With Losses In Excess Of $100,000 of Deadline in Class Action Lawsuit Against GeneDx Holdings Corp. - WGS
NEW YORK CITY & NEW ORLEANS--(BUSINESS WIRE)--Kahn Swick & Foti, LLC (“KSF”) and KSF partner, the former Attorney General of Louisiana, Charles C. Foti, Jr., remind investors that they have until August 3, 2026 to file lead plaintiff applications in a securities class action lawsuit against GeneDx Holdings Corp. (NasdaqGS: WGS) (“GeneDx” or the “Company”), if they purchased or otherwise acquired the Company’s shares between April 16, 2025 and May 4, 2026, inclusive (the “Class Period”). Thi...

-
A 2PointZero Group globális növekedési pályára lépett: árbevétele 21,9 milliárd AED-re, nettó nyeresége pedig 7,7 milliárd AED-re emelkedett 2026 első félévében
ABU DZABI, Egyesült Arab Emírségek--(BUSINESS WIRE)--A 2PointZero Group (ADX: 2POINTZERO), a vezető, Abu-Dzabiban működő befektetési holdingtársaság bejelentette 2026 első félévére vonatkozó pénzügyi eredményeit: árbevétele 21,9 milliárd AED volt, a csoport nettó nyeresége pedig elérte a 7,7 milliárd AED-t. Ezt az erőteljes teljesítményt tükrözi a csoport korrigált EBITDA-ja is, amely a valós érték változásainak és az egyszeri tételeknek a kiszűrését követően 5,0 milliárd AED-re emelkedett. A c...

-
FIA Completes ‘Deal of the Century’ for FIA World and European Rally Championships
PARIS--(BUSINESS WIRE)--The Fédération Internationale de l’Automobile (FIA) has announced a landmark long-term commercial rights agreement for the FIA WRC and FIA ERC....

-
PBCO Announces Cash Dividend
MEDFORD, Ore.--(BUSINESS WIRE)--PBCO Financial Corporation (OTCID: “PBCO”), the holding company (Company) of People’s Bank of Commerce (Bank), today announced that it has declared a cash dividend of $0.14 per share, approximately 15% of year-to-date net income through June 30, 2026. The $0.14 dividend will be paid on September 10, 2026, to shareholders of record August 20, 2026. “I am pleased to report this semi-annual cash dividend that reflects our strong performance for the first half of 202...

-
PROCEPT BioRobotics Corporation (PRCT) Investors: September 22, 2026, Deadline in Securities Fraud Class Action Lawsuit – Contact Kessler Topaz Meltzer & Check, LLP
RADNOR, Pa.--(BUSINESS WIRE)--Kessler Topaz Meltzer & Check, LLP (www.ktmc.com), a nationally recognized securities litigation law firm, informs investors that a securities fraud class action lawsuit has been filed against PROCEPT BioRobotics Corporation (PROCEPT) (NASDAQ: PRCT) on behalf of those who purchased or acquired PROCEPT common stock between February 28, 2024 and February 25, 2026, inclusive. The lawsuit is filed in the United States District Court for the Northern District of Cal...
-
Mission Valley Bancorp Reports Second Quarter Results
SUN VALLEY, Calif.--(BUSINESS WIRE)--Mission Valley Bancorp (OTCQX: MVLY, “Mission Valley”, or the “Company”) announced today net income of $1.8 million, or $0.54 per diluted share, for the second quarter of 2026, compared to net income of $1.2 million, or $0.37 per diluted share, for the second quarter of 2025. Net income for the six months ended June 30, 2026 was $2.5 million, or $0.76 per diluted share, compared to net income of $2.8 million, or $0.84 per diluted share, for the six months en...
-
Sherritt Responds to Requisition
TORONTO--(BUSINESS WIRE)--Sherritt International Corporation (“Sherritt” or the “Corporation”) (TSX:S) today announced its response to the requisition received from Kyma Capital Opportunities Master Fund Limited (“Kyma”), a beneficial shareholder, on July 22, 2026 to reconstitute the Board with two new directors and Kyma's existing Board nominee. Following careful review and consultation with legal counsel, the board of directors of the Corporation (the “Board”) has determined that the requisit...