

Newsroom
Sorted by: Latest
-
Generational Group Advises Farabaugh Engineering & Testing Inc. in Its Sale to Certerra
DALLAS--(BUSINESS WIRE)--Generational Group, a leading mergers and acquisitions advisory firm for privately held businesses, is pleased to announce the sale of Farabaugh Engineering & Testing Inc. to Certerra. The acquisition closed August 15, 2025. Headquartered in McKeesport, Pennsylvania, Farabaugh Engineering & Testing Inc. (FETLabs) is a family-owned, full-service engineering laboratory with more than 35 years of experience in the building components industry. The company provides...
-
Inszone Insurance Services Expands Presence in Arkansas With Acquisition of Williamson Insurance
SACRAMENTO, Calif.--(BUSINESS WIRE)--Inszone Insurance Services, a rapidly growing national provider of commercial, personal, and benefits insurance, is pleased to announce the acquisition of Mark V. Williamson Co., Inc., also known as Williamson Insurance, a long-standing independent agency based in Little Rock, Arkansas. Founded in 1974 by Mark V. Williamson, Williamson Insurance has served businesses and individuals across Arkansas for over five decades. The agency has built a strong reputat...
-
Label Printing Global Market Forecast 2025-2032: New Regulatory Demands, Technological Advancements, and Mounting Obligations Around Sustainability Reshape Industry Dynamics - ResearchAndMarkets.com
DUBLIN--(BUSINESS WIRE)--The "Label Printing Market - Global Forecast 2025-2032" report has been added to ResearchAndMarkets.com's offering. The global label printing market is undergoing rapid transformation as organizations encounter new regulatory demands, technological advancements, and mounting obligations around sustainability. Senior leaders who adopt future-oriented labeling strategies can better navigate compliance pressures, supply chain evolution, and the growing need for greater tra...
-
Ein Jahrzehnt an die Spitze der Welt: Geekvape feiert sein 10-jähriges Jubiläum mit der Besteigung des Mount Everest
SHENZHEN, China--(BUSINESS WIRE)--Anlässlich seines zehnjährigen Bestehens erreichte Geekvape nach monatelanger Vorbereitung, intensivem Training und einem zweiwöchigen Aufstieg den Gipfel des Mount Everest. Diese Leistung war weit mehr als ein symbolischer Akt: Sie stellte eine echte Bewährungsprobe für Ausdauer, Disziplin und Überzeugung dar – genau jene Werte, die Geekvape seit einem Jahrzehnt prägen. Inspiriert vom Everest: Respekt vor dem Berg, Respekt vor der Herausforderung Für Geekvape...
-
A Decade to the Top of the World: Geekvape Marks Its 10th Anniversary by Reaching the Summit of Everest
SHENZHEN, China--(BUSINESS WIRE)--To celebrate its 10th anniversary, Geekvape reached the summit of Mount Everest after months of preparation, training, and a two-week ascent. More than a symbolic act, it was a real test of endurance, discipline, and belief—the same values that have defined Geekvape for a decade. Inspired by Everest: Respecting Everest, Respecting the Challenge For Geekvape, the journey began months in advance with route planning, environmental assessment, physical training, an...
-
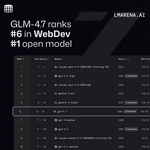
Z.ai Open-Sources GLM-4.7, a New Generation Large Language Model Built for Real Development Workflows
SINGAPORE--(BUSINESS WIRE)--Z.ai released GLM-4.7 ahead of Christmas, marking the latest iteration of its GLM large language model family. As open-source models move beyond chat-based applications and into production environments, they are increasingly expected to handle long-running tasks. GLM-4.7 has been developed with these requirements in mind. Unlike earlier systems focused on single-turn interactions, GLM-4.7 targets development environments that involve longer task cycles, frequent tool...
-
Generational Group Advises Swift Health Medical Group in its Sale to a Private Medical Practice
DALLAS--(BUSINESS WIRE)--Generational Group, a leading mergers and acquisitions advisory firm for privately held businesses, is pleased to announce the sale of Swift Health Medical Group to a Private Medical Practice. The acquisition closed November 25, 2025. Headquartered in Atlanta, Georgia, Swift Health Medical Group is an urgent care clinic that provides immediate, non-emergency medical services for patients of all ages. The clinic offers walk-in treatment for common illnesses and injuries,...
-
The Visual Effects Market: Global Industry Dynamics and Strategic Forecast Report (2025-2032) Featuring 3DAR, Adobe, Digital Domain, Eastman Kodak, Weta FX, Zoic Studios and More - ResearchAndMarkets.com
DUBLIN--(BUSINESS WIRE)--The "Visual Effects Market - Global Forecast 2025-2032" report has been added to ResearchAndMarkets.com's offering. The visual effects market is entering a period of strategic transformation, with new technologies, shifting workflows, and evolving production needs shaping industry priorities for senior decision-makers across media, entertainment, and creative enterprises. Market Snapshot: Visual Effects Market Growth and Opportunities The visual effects market grew from...
-
Sable Offshore Corp. Announces Receipt of Emergency Special Permit from PHMSA for Santa Ynez Pipeline System Segments
HOUSTON--(BUSINESS WIRE)--Sable Offshore Corp. Announces Receipt of Emergency Special Permit from PHMSA for Santa Ynez Pipeline System Segments...
-
Clinical Trial Supply & Logistics Market to Nearly Double in Size During 2025-2032: Adoption of Decentralized Clinical Trial Models Driving Demand for Localized Logistics Networks - ResearchAndMarkets.com
DUBLIN--(BUSINESS WIRE)--The "Clinical Trial Supply & Logistics Market - Global Forecast 2025-2032" report has been added to ResearchAndMarkets.com's offering. The clinical trial supply & logistics market is seeing transformative shifts driven by regulatory complexity, operational advances, and increased demand for patient-centric models. Senior leaders face evolving pressures that demand robust strategies to manage sourcing, distribution, compliance, and innovation. Market Snapshot: Cl...