

Newsroom
Sorted by: Latest
-
Samenvatting: SBC Medical maakt bekend dat de eerder aangekondigde secundaire openbare aanbieding van 3,1 miljoen gewone aandelen is afgerond
IRVINE, Calif.--(BUSINESS WIRE)--SBC Medical Group Holdings Incorporated (Nasdaq: SBC) ("het Bedrijf"), een Management Services Organization die actief is in een grote verscheidenheid aan franchiseactiviteiten in diverse medische domeinen, heeft vandaag bekendgemaakt dat het de eerder aangekondigde secundaire openbare aanbieding van 3.100.000 gewone aandelen van het bedrijf door Dr. Yoshiyuki Aikawa (de "Verkopende Aandeelhouder") heeft afgerond tegen de openbare uitgifteprijs van $ 3,25 per aa...
-
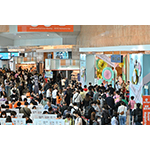
香港貿易発展局(HKTDC)主催の7つのライフスタイルフェアが、ソーシングを強化し香港のクリエイティブ産業を紹介
香港--(BUSINESS WIRE)--(ビジネスワイヤ) -- 香港貿易発展局(HKTDC)は、7つの大型イベントの開催を予定しています。これには、香港ギフト&プレミアムフェア、ホーム・インスタイルとファッション・インスタイル(4月27日~30日、香港コンベンション&エキシビションセンター(HKCEC)にて開催)、香港国際印刷・包装見本市とデラックス・プリントパック香港(アジアワールド・エキスポにて同時開催)、香港国際ライセンシングショー、アジア・ライセンシング会議(4月27日~29日、HKCECにて開催)が含まれます。これらのイベントは、香港のクリエイティブ産業と中国本土および世界市場を結びつけ、地域のクリエイティブハブとしての香港の役割を強化します。 トレンドを牽引するギフトが調達の火付け役に ギフト&プレミアムフェアでは、世界有数のデザインブランドが集まる注目の展示スペースとなるファイン・デザイン・ホールが設けられます。今回のフェアでは、浙江省商務庁が初めて主催する拡張版浙江省パビリオンに加え、山西省パビリオンが初登場します。さらに、スマート・デザイン・グローバルは、フェア...

-
Sieben HKTDC Lifestyle-Messen unterstützen den Einkauf und präsentieren Hongkong’s Kreativbranche
HONGKONG--(BUSINESS WIRE)--Der Hong Kong Trade Development Council (HKTDC) veranstaltet Mega-Events wie die Hong Kong Gifts & Premium Fair, Home InStyle und Fashion InStyle (vom 27. bis 30. April im Hong Kong Convention and Exhibition Centre, HKCEC); die Hong Kong International Printing & Packaging Fair und DeLuxe PrintPack Hong Kong (gleichzeitig mit der AsiaWorld-Expo) und die Hong Kong International Licensing Show mit der Asian Licensing Conference (vom 27. bis 29. April im HKCEC). A...

-
Siete ferias de estilo de vida del HKTDC impulsan el abastecimiento y difunden las industrias creativas de Hong Kong
HONG KONG--(BUSINESS WIRE)--El Consejo de Desarrollo Comercial de Hong Kong (HKTDC) celebrará siete megaeventos, entre ellos: Hong Kong Gifts & Premium Fair , Home InStyle y Fashion InStyle (27 al 30 de abril en el Centro de Convenciones y Exposiciones de Hong Kong, HKCEC); Hong Kong International Printing & Packaging Fair y DeLuxe PrintPack Hong Kong (se celebraron de manera conjunta en AsiaWorld-Expo); y Hong Kong International Licensing Show y Asian Licensing Conference (27 al 29 de...

-
Riassunto: Sette fiere del potere del lifestyle HKTDC potenziano la ricerca e la promozione delle industrie creative di Hong Kong
HONG KONG--(BUSINESS WIRE)--L'Hong Kong Trade Development Council (HKTDC) sta ospitando sette mega eventi, compresa la Hong Kong Gifts & Premium Fair, Home InStyle e Fashion InStyle (27-30 aprile al Hong Kong Convention and Exhibition Centre, HKCEC); la Hong Kong International Printing & Packaging Fair e DeLuxe PrintPack Hong Kong (svoltesi insieme nell'AsiaWorld-Expo); il Hong Kong International Licensing Show e la Asian Licensing Conference (27-29 aprile all'HKCEC). Questi eventi coll...

-
Sete feiras de Estilo de Vida da HKTDC impulsionam e apresentam as indústrias criativas de Hong Kong
HONG KONG--(BUSINESS WIRE)--O Conselho de Desenvolvimento Comercial de Hong Kong (HKTDC) está organizando sete megaeventos, incluindo a Feira Gifts & Premium de Hong Kong, Home InStyle e Fashion InStyle (de 27 a 30 de abril no Centro de Convenções e Exposições de Hong Kong, HKCEC); a Feira Internacional Printing & Packaging de Hong Kong e a DeLuxe PrintPack Hong Kong (realizadas simultaneamente na AsiaWorld-Expo); a Feira Internacional de Licenciamento de Hong Kong e a Conferência Asiát...
-
Riassunto: Aumentano le rivendite: la funzionalità di rivendita di Klarna cresce del 75% mentre i consumatori si rimettono vero denaro in tasca
STOCCOLMA--(BUSINESS WIRE)--Nuovi dati forniti da Klarna, banca digitale globale e fornitore di pagamenti flessibili, rivelano che la sua funzionalità di rivendita integrata nell'applicazione sta diventando molto diffusa: gli annunci creati tramite l'app sono aumentati fino al 75% negli ultimi 13 mesi*, poiché i consumatori ricorrono sempre più spesso alla rivendita come modo per guadagnare denaro reale da oggetti già in loro possesso. I dati puntano a un più ampio cambiamento nei comportamenti...
-
Resumen: La reventa, en auge: esta función de Klarna crece un 75 % mientras los consumidores recuperan su dinero
ESTOCOLMO--(BUSINESS WIRE)--Nuevos datos presentados por Klarna, el banco digital y proveedor de pagos flexibles a nivel global, demuestran que la función de reventa dentro de la app está cobrando cada vez más relevancia: los anuncios creados a través de la aplicación crecieron hasta un 75 % en los últimos 13 meses* gracias que los consumidores recurren cada vez más a la reventa como una forma de obtener ingresos a partir de artículos propios. Los datos señalan un cambio generalizado en los háb...
-
Samenvatting: Doorverkoop in de lift: Klarna's doorverkoopfunctie stijgt met 75% nu consumenten echt geld opnieuw in hun zakken steken
STOCKHOLM--(BUSINESS WIRE)--Nieuwe gegevens van Klarna, de internationale digitale bank en aanbieder van flexibele betalingen, onthullen dat de in-app doorverkoopfunctie aanzienlijk momentum wint: advertenties aangemaakt via de app zijn de voorbije 13 maanden met 75% gestegen*, nu consumenten steeds meer op doorverkoop beroep doen als een manier om echt geld te verdienen aan artikelen die ze al bezitten. De gegevens wijzen op een ruimere verschuiving in financieel gedrag: consumenten behandelen...
-
La revente a le vent en poupe : la fonctionnalité de revente de Klarna enregistre une hausse de 75 %, permettant aux consommateurs de récupérer de l'argent
STOCKHOLM--(BUSINESS WIRE)--De nouvelles données fournies par Klarna, la banque numérique internationale et prestataire de solutions de paiement flexibles, révèlent que sa fonctionnalité de revente intégrée à l'application connaît un essor considérable : les annonces publiées via l'application ont augmenté de près de 75 % au cours des 13 derniers mois*, les consommateurs se tournant de plus en plus vers la revente pour gagner de l'argent réel grâce aux articles qu'ils possèdent déjà. Ces donnée...