

Newsroom
Sorted by: Latest
-
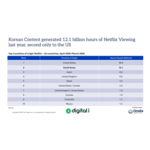
Omdia: South Korean Productions are Netflix’s Most-Watched Content Outside the US
LONDON--(BUSINESS WIRE)--South Korean content generated 12.1 billion hours of viewing on Netflix worldwide between April 2025 and March 2026, making it the most-watched content origin outside of the United States, according to new analysis from Omdia and Digital i revealed at the International Streaming Summit (OTT·FAST) 2026 in Busan this week. The analysis found that South Korean content generated 44% more viewing than Japanese content and nearly twice as much viewing as content from the Unit...
-
ABIONYX Pharma annonce le succès de son financement pour un montant total maximum de 33 M€
TOULOUSE, France & FULLERTON, Calif.--(BUSINESS WIRE)--Regulatory News: ABIONYX Pharma (FR0012616852 – ABNX – éligible au PEA‑PME) (« ABIONYX » ou la « Société »), société biopharmaceutique de nouvelle génération qui développe des thérapies innovantes dans le sepsis et les soins intensifs, fondées sur une plateforme technologique exclusive basée sur l’apoA‑I, annonce aujourd’hui le succès de l'augmentation de capital avec maintien du droit préférentiel de souscription (« DPS ») des actionnaires...
-
ABIONYX Pharma Announces the Success of its Financing for a Total Maximum Amount of EUR 33 M
TOULOUSE, France & FULLERTON, Calif.--(BUSINESS WIRE)--Regulatory News: ABIONYX Pharma (FR0012616852 – ABNX – eligible for PEA-PME) (“Abionyx” or the “Company”), a next-generation biopharmaceutical company developing innovative therapies in sepsis and critical care based on its exclusive apoA-I technology platform, today announces the success of its capital increase with preferential subscription rights (the “Rights Issue”), launched on May 27, 2026, which has been subscribed at 100% after part...
-
FDA Accepts Supplemental Biologics License Application for Genentech’s Lunsumio and Polivy Combination for People With Relapsed or Refractory Large B-Cell Lymphoma
SOUTH SAN FRANCISCO, Calif.--(BUSINESS WIRE)--Genentech, a member of the Roche Group (SIX: RO, ROP; OTCQX: RHHBY), announced today that the U.S. Food and Drug Administration (FDA) has accepted the company’s supplemental Biologics License Application (sBLA) for Lunsumio VELO™ (mosunetuzumab-axgb), as a subcutaneous formulation, in combination with Polivy® (polatuzumab vedotin-piiq) for the treatment of adult patients with relapsed or refractory large B-cell lymphoma (LBCL), including diffuse larg...
-
FIFA World Cup: Fraud Attempts Surged More Than Threefold at Past World Cups, ACI Worldwide Finds
OMAHA, Neb.--(BUSINESS WIRE)--As the 2026 FIFA World Cup gets underway, new analysis from ACI Worldwide (NASDAQ: ACIW), an original innovator in global payments technology, shows that the fraud patterns seen around previous major tournaments are already in play, exposing fans and ticket sellers to heightened risks. Based on 24.5 million transactions across 61 live-event merchants serving global fan audiences, ACI’s data reveals the same warning signs that preceded fraud surges during Copa Ameri...

-
Axcelead DDP Joins Lilly TuneLab to Advance AI Drug Discovery
FUJISAWA, Japan--(BUSINESS WIRE)--Axcelead Drug Discovery Partners, Inc. (Axcelead DDP) is pleased to announce that it has entered a collaboration with Lilly TuneLab, a collaborative AI/ML drug discovery platform created by Eli Lilly and Company (Lilly). Lilly TuneLab is designed to accelerate early stage discovery by enabling participating biotech partners to access drug discovery models trained on decades of Lilly’s proprietary research data. Under this collaboration, Axcelead DDP will be abl...
-
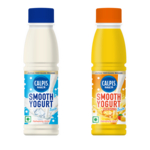
Asahi Group Announces Debut in India’s Non-alcohol/Non-carbonated Beverage Market
TOKYO--(BUSINESS WIRE)--Asahi Group Holdings, Ltd. announced today that it has entered into a business alliance agreement for franchising the CALPIS brand with Varun Beverages Limited (“Varun Beverages”), an India-based manufacturer, distributor and seller of non-alcohol beverages, to introduce the CALPIS products into the Indian market. Starting in the second half of 2026 or thereafter, a ready-to-drink, non-alcohol/non-carbonated dairy based product will be launched under the name CALPIS, wit...
-
ベンチャー・グローバルとEnBW、新たなLNG購入契約を発表
バージニア州アーリントン--(BUSINESS WIRE)--(ビジネスワイヤ) -- ベンチャー・グローバル(NYSE: VG)とEnBWは、法的拘束力のある新たな売買契約を締結したと発表しました。契約は、ベンチャー・グローバルのポートフォリオから供給される年間約82万トン(MTPA)の米国産液化天然ガス(LNG)を2026年から約5年間、ベンチャー・グローバルから購入するというものです。この新たな契約は、ベンチャー・グローバルとEnBWとの間で既に締結されている、20年間にわたり年間200万トン(2 MTPA)を供給する既存の長期売買契約(SPA)に追加されるものです。 「ドイツを代表するLNGサプライヤーの一つとして、ベンチャー・グローバルはEnBWとのパートナーシップを強化し、信頼性の高いLNG供給によって地域のエネルギー安全保障を支援できることを誇りに思います」と、ベンチャー・グローバルの最高経営責任者(CEO)であるMike Sabelは述べています。「今回の新しい中期契約は、EnBWとの長年にわたる強固な関係を基盤としており、お客様の進化するエネルギー・ニーズに応えると...
-
Venture Global與EnBW宣布達成最新液化天然氣購買協議
維吉尼亞州,阿靈頓--(BUSINESS WIRE)--(美國商業資訊)-- Venture Global, Inc. (NYSE: VG) 和EnBW今天宣布簽署最新的約束性協議,計劃從2026年起在約五年時間內從Venture Global的供應組合中採購約每年82萬噸 (MTPA) 的美國液化天然氣 (LNG)。這些新協議補充Venture Global與EnBW之間既有的長期銷售及購買協議 (SPA)——內容為每年200萬噸、為期20年。 「Venture Global身為德國一流液化天然氣供應商,很高興能夠深化與EnBW的合作關係,並藉由穩定供應液化天然氣來保障這個地區的能源安全。」Venture Global執行長Mike Sabel表示,「這些最新中期協議以我們與EnBW穩固且長期的合作關係為基礎,也證明我們有決心滿足客戶不斷變化的能源需求。我們動能十足的行銷平台為我們帶來獨特優勢,能夠提供短期、中期及長期的供應解決方案。」 關於Venture Global Venture Global是美國低成本液化天然氣(LNG)的生產商和出口商,其在產、在建及開發中的產能超過1億公...
-
Venture Global与EnBW宣布达成新的液化天然气购销协议
美国弗吉尼亚州阿灵顿--(BUSINESS WIRE)--(美国商业资讯)-- 今日,Venture Global, Inc.(纽约证券交易所代码:VG)与EnBW宣布签署新的具有约束力的协议。根据协议,自2026年起约五年内,EnBW将从Venture Global采购约82万吨/年的美国液化天然气(LNG),相关供应将来自Venture Global旗下液化天然气项目组合。此次新协议是在双方现有长期合作基础上的进一步深化。此前,Venture Global与EnBW已签署长期液化天然气购销协议(SPA),约定在20年合同期内每年供应200万吨液化天然气。 Venture Global首席执行官Mike Sabel表示:“作为德国领先的液化天然气供应商之一,Venture Global很荣幸能够进一步深化与EnBW的合作伙伴关系,并通过稳定可靠的液化天然气供应支持欧洲地区的能源安全。此次新签署的中期协议是在双方长期稳固合作关系基础上的进一步拓展,彰显了我们致力于满足客户不断演变的能源需求的坚定承诺。凭借灵活高效的市场营销平台,我们拥有独特优势,能够为客户提供覆盖短期、中期及长期需求的...