Newsroom
Sorted by: Latest
-
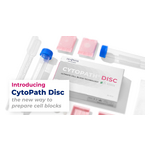
StatLab lancia CytoPath Disc e promuove la preparazione standardizzata dei citoinclusi in tutto il mondo
MCKINNEY, Texas--(BUSINESS WIRE)--StatLab Medical Products, azienda leader a livello mondiale nello sviluppo e nella produzione di strumenti, reagenti e consumabili per il laboratorio, ha annunciato oggi il lancio globale di CytoPath Disc, un’innovativa tecnologia per la preparazione di citoinclusi progettata per standardizzare e semplificare tale processo. Sviluppato come alternativa ai tradizionali metodi di citoinclusione, che trasformano materiale cellulare sospeso in un fluido in un format...
-
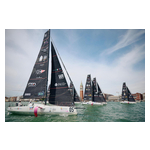
Deutsche Crews schließen sich der Marina Militare Nastro Rosa Tour 2026 rund um die Küste Italiens an
VENEDIG, Italien--(BUSINESS WIRE)--Zwei deutsche Teams nehmen an der 6. Ausgabe der Marina Militare Nastro Rosa Tour 2026 teil – das Segelrennen um Italien, das am 4. Juni in Venedig begonnen hat und am 12. Juli in Genua enden wird, nach 9 Etappen und 1.250 Seemeilen um die italienische Küste. Organisiert wird der Wettkampf von Difesa Servizi, dem eigenen Unternehmen des italienischen Verteidigungsministeriums, in Zusammenarbeit mit dem auf den Segelsport spezialisierten Sportmarketingunternehm...
-
HSBC Bank Plc UK Regulatory Announcement: Early Repurchase(s)
LONDON--(BUSINESS WIRE)-- ISIN GB00BQTPLT30 Issuer Name HSBC Bank Plc Paying Agent HSBC Bank Plc Redemption Type Repurchase Currency USD O/S Balance 6,928,406.00 New Balance 0.00 Value Date 24-Jun-26 ...
-
Cambia Health Foundation Welcomes Allison Gruber as New Leader
PORTLAND, Ore.--(BUSINESS WIRE)--Cambia Health Foundation is pleased to announce that Allison Gruber will serve as its vice president and leader, effective June 24, 2026....

-
Mary Kay nie schodzi z podium – tytuł marki nr 1 na świecie w kategorii kosmetyków upiększających dostępnych w sprzedaży bezpośredniej obroniony już czwarty rok z rzędu
DALLAS--(BUSINESS WIRE)--Mary Kay Inc., kultowy producent kosmetyków i lider biznesu, po raz kolejny otrzymała tytuł marki nr 1 na świecie w kategorii kosmetyków do pielęgnacji skóry i makijażu dostępnych w sprzedaży bezpośredniej1 przyznany przez Euromonitor International już czwarty rok z rzędu w dowód uznania trwałego dziedzictwa opartego na doskonałości. – Uzyskanie tytułu marki nr 1 na świecie od firmy Euromonitor już czwarty rok z rzędu to zdecydowane potwierdzenie wpływu działalności nas...
-
HSBC Bank Plc UK Regulatory Announcement: Early Repurchase(s)
LONDON--(BUSINESS WIRE)-- ISIN GB00BTDGQ540 Issuer Name HSBC Bank Plc Paying Agent HSBC Bank Plc Redemption Type Repurchase Currency USD O/S Balance 7,407,407.00 New Balance 0.00 Value Date 24-Jun-26 ...
-
Bailard Named to Inaugural CNBC Elite Advisors List
SAN FRANCISCO--(BUSINESS WIRE)--Bailard, Inc., an independent wealth and asset management firm, has been named to the inaugural CNBC Elite Advisors list. CNBC recognizes 25 U.S. registered investment advisors (RIAs) with a record of serving ultra-high-net-worth (UHNW) clients and families across the full range of services they require. Founded in 1969 and based in the San Francisco Bay Area, Bailard is both a wealth manager and an asset manager, serving individuals, families, and institutions....
-
Mary Kay prolonge sa série de victoires avec sa quatrième année en tant que n°1 mondial de la vente directe de produits de beauté
DALLAS--(BUSINESS WIRE)--Mary Kay Inc., l'entreprise emblématique au service de la beauté et de l'entrepreneuriat, a de nouveau été nommée n°1 mondial de la vente directe de produits de soins de la peau et de cosmétiques de couleur1 par Euromonitor International, perpétuant ainsi son héritage d'excellence pour la quatrième année consécutive. « Recevoir la première place mondiale d’Euromonitor pour la quatrième année consécutive est une véritable validation approbation de l’impact de nos conseil...
-
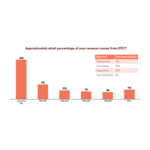
New Appcharge Research: Direct-to-Consumer is Already a $17Bn Market in Mobile Gaming – and the Rest of the App Economy is Set to Follow
TEL AVIV, Israel--(BUSINESS WIRE)--Direct-to-consumer (DTC) monetisation in mobile gaming is already a $17Bn market – around 15% of the $113.3Bn mobile gaming in-app purchase market1 – and is expected to grow substantially through 2026, according to new research published today by GDC Festival of Gaming and Appcharge, the leading DTC payments infrastructure platform for mobile games. Based on a survey of more than 1,200 professional game developers conducted between January and February 2026, t...
-
エアシップ、ローラ・ズワーレンを最高収益責任者に任命
サンフランシスコ--(BUSINESS WIRE)--(ビジネスワイヤ) -- エアシップ(Airship)は、モバイル・ファーストの顧客体験企業であり、ローラ・ズワーレンを最高収益責任者(CRO)に任命したことを発表しました。ズワーレンは、グローバルなすべての収益創出活動を統括し、エアシップの営業、アカウント・マネジメント、カスタマー・サクセスの各チームを横断して、連携体制の構築、施策の実行、戦略の推進を担うことで、同社の市場リーダーシップの強化と顧客への価値提供の拡大を加速させます。ズワーレンは、最高経営責任者(CEO)のブレット・ケインに直属します。 ズワーレンは、市場開拓および収益領域のリーダーとして20年以上の経験を有し、急成長、戦略的買収、株式公開の局面にあるテクノロジー企業を導いてきた確かな実績があります。以前は、AdRollおよびAdRoll ABMの親会社であるNextRollでCROを務め、グローバルな収益チームを率いるとともに、持続的な成長、オペレーショナル・エクセレンス、組織の有効性を中心とした取り組みを推進しました。NextRoll以前には、LiveRamp...