

Newsroom
Sorted by: Latest
-
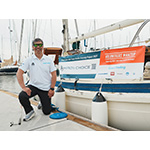
Blind Sailor Mitsuhiro Iwamoto Redefines the Limits of Possibility Through Technology in a Historic Trans-Pacific Project
FUJISAWA, Japan--(BUSINESS WIRE)--Mitsuhiro Iwamoto, a Japanese sailor based in San Diego, who is taking on the world’s first solo, non-stop trans-Pacific crossing by a blind sailor as part of the Blind Sailor Single-Handed Pacific Crossing Project 2027, held a press conference on January 28 (local time) in San Diego, USA. Project URL: https://hiros-choice.com/ On January 22 (local time), Iwamoto delivered a speech at the World Economic Forum Annual Meeting 2026 (WEF) under the theme “Sailing T...
-
-
Rakuten Mobile to Deploy 1Finity Open RAN Massive MIMO Radios at Scale
KAWASAKI, Japan--(BUSINESS WIRE)--Rakuten Mobile to deploy 1Finity massive MIMO Open RAN radios at scale to enhance capacity and coverage for network customers across Japan....
-
Asian Enterprises Shift to Managed, Internet-First Networks
SYDNEY--(BUSINESS WIRE)--Enterprises in Asia Pacific are modernizing networks with internet-first managed services spanning network, security and cloud operations, ISG says....
-
INVESTOR ALERT: Securities Class Action Filed Against Ramaco Resources, Inc. – Contact Kirby McInerney LLP
NEW YORK--(BUSINESS WIRE)--The law firm of Kirby McInerney LLP announces that a class action lawsuit has been filed on behalf of investors who acquired Ramaco Resources, Inc. (“Ramaco” or the “Company”) (NASDAQ:METC) securities during the period of July 31, 2025 through October 23, 2025, inclusive (“the Class Period”). If you suffered a loss on your Ramaco investments, you have until March 31, 2026 to request lead plaintiff appointment. Courts do not consider lead plaintiff applications submitt...
-
レーザーフィッシュのテイラー・グロッソ、2026年CRN®チャンネル・チーフに選出され表彰
カリフォルニア州ロングビーチ--(BUSINESS WIRE)--(ビジネスワイヤ) -- インテリジェント・コンテンツ管理をリードするSaaSプロバイダーであるレーザーフィッシュは、CRN®(ザ・チャンネルカンパニーのブランド)が、レーザーフィッシュの米州チャンネル担当シニアディレクターであるテイラー・グロッソを、2026年CRN®チャンネル・チーフ(2026 CRN® Channel Chief)に選出したことを発表しました。本表彰は毎年、チャンネル戦略を形成し、業界全体にわたってイノベーションおよびパートナーシップを推進しているITベンダーおよびディストリビューション分野のエグゼクティブを称えるものです。 グロッソは、米国、カナダおよび中南米を含むレーザーフィッシュの米州チャンネル営業チームを統括しており、市場の進化に伴い競争力を維持できるよう、レーザーフィッシュのソリューション・プロバイダーを支援することに注力しています。AIを活用したツールによって生産性向上を図ろうとする企業が増える中、グロッソは、レーザーフィッシュの業界をリードするAI搭載文書管理ソリューションをパートナ...

-
Investor Notice: Shareholder Rights Law Firm Robbins LLP Informs Investors of the Richtech Robotics Inc. Securities Class Action Lawsuit
SAN DIEGO--(BUSINESS WIRE)--Robbins LLP informs stockholders that a class action was filed on behalf of all investors who purchased or otherwise acquired Richtech Robotics Inc. (NASDAQ: RR) securities between January 27, 2026 and 12:00 PM EST on January 29, 2026. Richtech describes itself as a “robotics and artificial intelligence (“AI”) technology company focused on developing advanced embodied AI systems that aims to improve the efficiency and productivity of U.S. businesses.” For more inform...

-
CION Investment Corporation Announces Pricing of Public Offering of Unsecured Notes Due 2031
NEW YORK--(BUSINESS WIRE)--CION Investment Corporation (NYSE: CION) (the “Company” or “CION”) announced today that it has priced an underwritten public offering of $125.0 million aggregate principal amount of unsecured notes due 2031 (the “Notes”), which will result in net proceeds to the Company of approximately $121.25 million after the payment of underwriting discounts and commissions and not including estimated offering expenses payable by the Company. The Notes will mature on March 31, 203...
-
Ellington Financial Announces the Income Tax Treatment of its 2025 Distributions
OLD GREENWICH, Conn.--(BUSINESS WIRE)--Ellington Financial Inc. (NYSE: EFC) (the "Company") today announced that information regarding the federal income tax treatment of the distributions deemed paid in 2025 on the Company's common and preferred stock has been posted to the Company’s website, at the following links. Common Stock: https://ir.ellingtonfinancial.com/dividends-common-stock Series A Preferred Stock: https://ir.ellingtonfinancial.com/dividends-preferred-stock Series B Preferred Stoc...
-
GenFlat Announces Pricing of $7.0 Million Public Offering and OTCQB Uplisting
TOOELE, Utah--(BUSINESS WIRE)--GenFlat Holdings, Inc. (OTC PINK:GFLT) (“GenFlat” or “the Company”), a developer of sustainable collapsible marine shipping containers, today announced the pricing of an underwritten public offering of 2,333,333 shares of its common stock, at a price of $3.00 per share. The offering is expected to yield approximately $7.0 million in gross proceeds before offering expenses and underwriting discounts and commissions. The offering is expected to close on February 4,...