Newsroom
Sorted by: Latest
-
UBS reports 2Q26 net profit of USD 2.8bn and USD 5.8bn for 1H26 with robust momentum across businesses; Group invested assets at USD 7.3trn (Ad hoc announcement pursuant to Article 53 of the SIX Exchange Regulation Listing Rules)
ZURICH--(BUSINESS WIRE)--Regulatory News: UBS (NYSE:UBS) (SWX:UBSN): “Almost three years ago, we presented our first set of consolidated results. From the beginning, I made it clear that the acquisition of Credit Suisse was not a gift that we received, but rather a prize that we would all have to fight to win. As expected, the journey was not a straight line. It required a lot of hard work from my colleagues and painful decisions. Now these efforts are paying off and the extraordinary patience...
-
Forbes Names Ossium Health a 2026 Next Billion-Dollar Startup
SAN FRANCISCO--(BUSINESS WIRE)--Ossium Health is one of 20 U.S. startups on the 2026 Forbes Next Billion-Dollar Startups list, all expected to reach a $1 billion valuation....

-
Woodside Energy Second Quarter Report for Period Ended 30 June 2026
PERTH, Australia--(BUSINESS WIRE)--Woodside Energy's second quarter report for the period ended 30 June 2026....
-
Q3 2026 Insurance Labor Market Study Results to be Highlighted in Webinar
CHICAGO--(BUSINESS WIRE)--The results of the Q3 2026 U.S. Insurance Labor Market Study will be revealed in a webinar presentation at 1 p.m. CDT on August 13, 2026....

-
Investors of Pentair plc Should Contact Robbins LLP for Information About its Investigation of PNR
SAN DIEGO--(BUSINESS WIRE)--Shareholder rights law firm Robbins LLP is investigating Pentair plc (NYSE: PNR) to determine whether certain Pentair plc officers and directors violated securities laws and breached fiduciary duties to shareholders. Pentair plc provides various water solutions in the United States, Western Europe, China, Latin America, the Middle East, Southeast Asia, Australia, and Canada.On April 28, 2026, Pentair projected that second-quarter sales would increase approximately 1%...

-
Estée Lauder lance son nouveau parfum « Glimmer » avec une campagne mondiale mettant en vedette Hailee Steinfeld
NEW YORK--(BUSINESS WIRE)--Aujourd’hui, Estée Lauder lance Glimmer, un nouveau parfum de prestige conçu pour une nouvelle génération de consommatrices. Floral ambré aux accents gourmands, Glimmer puise son inspiration dans la magie des « lueurs » du quotidien – ces petits instants de joie, d’espoir et de connexion – pour offrir une expérience olfactive sensorielle pensée pour inspirer l’optimisme, renforcer le sentiment d’appartenance et laisser une impression durable. L’actrice et chanteuse de...

-
AUTOBACS SEVEN celebra 10 años de estabilidad de sus sistemas y de innovación autofinanciada con Rimini Street
LAS VEGAS--(BUSINESS WIRE)--Rimini Street, Inc. (Nasdaq: RMNI), la Software Support and Agentic AI ERP Company™ y proveedor líder de soporte externo para el software de Oracle, SAP y VMware, anuncia que AUTOBACS SEVEN Co., Ltd. celebra sus 10 años de asociación con Rimini Street, en lo que representa una década de operaciones básicas estables y reinversión en innovación. Desde que se migró a Rimini Support™ para SAP ECC 6 en 2016, AUTOBACS SEVEN ha ampliado su asociación para incluir Oracle Dat...

-
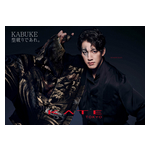
KATE Launches "KABUKE: Break Convention" Kabuki-Inspired International Campaign
TOKYO--(BUSINESS WIRE)--KATE’s “KABUKE: Break Convention” campaign launched on July 8, blending the Kabuki spirit with shadow enhancing makeup and self-expression....
-
Estée Lauder kündigt den neuen Duft „Glimmer“ an – mit einer weltweiten Kampagne, in der Hailee Steinfeld die Hauptrolle spielt
NEW YORK--(BUSINESS WIRE)--Estée Lauder gibt heute die Markteinführung von Glimmer bekannt, einem neuen Luxusduft, der für eine neue Generation von Verbrauchern kreiert wurde. Glimmer ist ein blumiger Duft mit bernsteinfarbenen Noten und einem Hauch von Gourmand-Aromen. Er verwandelt die Kraft der alltäglichen „Lichtblicke“ – kleine Momente der Freude, Hoffnung und Verbundenheit – in ein sinnliches Dufterlebnis, das Optimismus wecken, das Gemeinschaftsgefühl stärken und einen bleibenden Eindruc...

-
OpenHome and ElevenLabs Partner to Grow Voice AI Development in Japan
SAN FRANCISCO & TOKYO--(BUSINESS WIRE)--OpenHome and ElevenLabs Japan launch a developer program giving developers ElevenLabs credits for voice AI projects on OpenHome hardware....