

Newsroom
Sorted by: Latest
-
First Trust Global Funds PLC UK Regulatory Announcement: Net Asset Value(s)
LONDON--(BUSINESS WIRE)-- Funds Date TIDM ISIN Code Shares in Issue Currency Net Asset Value NAV/per Share FIRST TRUST INDXX FUTURE ECONOMY METALS UCITS ETF 29.07.2026 METL LN IE000UDFKE13 150,002.00 USD 5,222,245.14 34.815 ...
-
Marathon Asset Management Ltd UK Regulatory Announcement: Form 8.3
LONDON--(BUSINESS WIRE)-- FORM 8.3 PUBLIC OPENING POSITION DISCLOSURE/DEALING DISCLOSURE BY A PERSON WITH INTERESTS IN RELEVANT SECURITIES REPRESENTING 1% OR MORE Rule 8.3 of the Takeover Code (the “Code”) 1. KEY INFORMATION (a) Full name of discloser: Marathon Asset Management Limited (b) Owner or controller of interests and short positions disclosed, if different from 1(a): The naming of nominee or vehicle companies is insufficient. For a trust, the trustee(s), settlor and beneficiaries must...
-
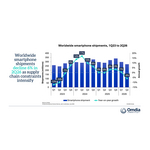
Omdia: Global Smartphone Shipments Fell 6% in 2Q26 as Supply-side Pressures Reshape the Market
LONDON--(BUSINESS WIRE)--Global smartphone shipments fell 6% year on year (YoY) to 272.0 million units in 2Q 2026, according to Omdia. This follows the front-loaded demand seen in 1Q26 which gave way to the adjustment phase of the memory cost cycle. Persistently high memory prices disrupted supply, increased component costs and forced vendors to rethink pricing, product portfolios and channel strategies. The result has been a sharply polarized market, with vendors' performance increasingly dete...
-
Marathon Asset Management Ltd UK Regulatory Announcement: Form 8.3
LONDON--(BUSINESS WIRE)-- Ap27 FORM 8.3 IRISH TAKEOVER PANEL OPENING POSITION DISCLOSURE/DEALING DISCLOSURE UNDER RULE 8.3 OF THE IRISH TAKEOVER PANEL ACT, 1997, TAKEOVER RULES, 2022 BY PERSONS WITH INTERESTS IN RELEVANT SECURITIES REPRESENTING 1% OR MORE 1. KEY INFORMATION (a) Full name of discloser Marathon Asset Management Limited (b) Owner or controller of interests and short positions disclosed, if different from 1(a) The naming of nominee or vehicle companies is insufficient. For a trust...
-
Deutschland bleibt pragmatisch bei vernetzter Technologie: Nutzen überzeugt, Kontrolle bleibt entscheidend
BONN, Germany--(BUSINESS WIRE)--Assurant, Inc. (NYSE: AIZ), ein weltweit tätiger US-Versicherungskonzern, der in Partnerschaft mit einigen der erfolgreichsten Marken der Welt vernetzte Geräte, Häuser und Fahrzeuge schützt, stellt heute die Ergebnisse für Deutschland aus seinem Global Connected Consumer Trends Report 2026 vor. Die Studie spiegelt globale Entwicklungen wider und zeigt, wie vernetzte Technologien zunehmend zu einem unverzichtbaren Bestandteil des täglichen Lebens deutscher Verbrau...
-
Germany Reflects a Balanced Path to Connected Living as Demand for Transparency and Control Grows
BONN, Germany--(BUSINESS WIRE)--Assurant, Inc. (NYSE: AIZ), a global company that redefines the boundaries of protection – safeguarding and servicing connected devices, homes, automobiles, and commercial equipment in partnership with the world’s most successful brands, today highlighted Germany-specific insights from its 2026 Global Connected Consumer Trends Report, underscoring broader global shifts in how connected technology is becoming essential to everyday life. The findings show Germany r...
-
Samson Rock Capital LLP UK Regulatory Announcement: Form 8.3
LONDON--(BUSINESS WIRE)-- FORM 8.3 PUBLIC OPENING POSITION DISCLOSURE/DEALING DISCLOSURE BY A PERSON WITH INTERESTS IN RELEVANT SECURITIES REPRESENTING 1% OR MORE Rule 8.3 of the Takeover Code (the “Code”) 1. KEY INFORMATION (a) Full name of discloser: SAMSON ROCK CAPITAL LLP (b) Owner or controller of interests and short positions disclosed, if different from 1(a): The naming of nominee or vehicle companies is insufficient. For a trust, the trustee(s), settlor and beneficiaries must be named....