

Newsroom
Sorted by: Latest
-
HUBG Investors Have Opportunity to Join Hub Group, Inc. Fraud Investigation with the Schall Law Firm
LOS ANGELES--(BUSINESS WIRE)--HUBG Investors Have Opportunity to Join Hub Group, Inc. Fraud Investigation with the Schall Law Firm...
-
Suite Studios Announces S3 Native File Streaming for Real-Time Media Workflows at Petabyte Scale
BOULDER, Colo.--(BUSINESS WIRE)--Suite Studios, a cloud-native platform that connects creative teams to their media in real time, today announced S3 Native File Streaming, a major enhancement that allows teams to work directly on petabyte-scale datasets stored in any S3 compatible object storage environment. With S3 Native File Streaming, Suite now operates natively on object storage, reading and writing files as standard S3 objects. The platform serves as a streaming and access layer within ex...
-
Moody’s Establishes Regional Headquarters in Saudi Arabia, Deepening Presence in Region
NEW YORK--(BUSINESS WIRE)--Moody’s Corporation (NYSE: MCO) announced today that it has established a regional headquarters (RHQ) in Riyadh, Saudi Arabia, reflecting Moody’s ongoing commitment to support the development of the Kingdom’s capital markets and economy. This investment aligns to the Kingdom's Vision 2030 initiative, and underscores its dynamism and growth. The new RHQ marks an expansion of Moody’s presence in Saudi Arabia, where the company first opened an office in 2018, and reflect...
-
El sultán bin Ahmed visita los estudios, el parque cinematográfico y el estadio de Shanghái
SHANGHÁI--(BUSINESS WIRE)--Su alteza el jeque Sultan bin Ahmed bin Sultan Al Qasimi, vicegobernador de Sharjah y presidente del Consejo de Medios de Comunicación de Sharjah, visitó el sábado los estudios y el parque cinematográfico de Shanghái, de una extensión de 800.000 metros cuadrados, ubicados en la localidad de Shidon, en la ciudad china de Shanghái. A través de una pieza audiovisual, Su Alteza pudo conocer en detalle las características de los estudios, que cuentan con cuatro sets profes...

-
Therma-Tru, Larson, Fiberon, Fypon and Solar Innovations Bring Breakthrough Materials and Immersive Design to the 2026 International Builders’ Show
DEERFIELD, Ill.--(BUSINESS WIRE)--A multi-sensory installation takes center stage at the International Builders’ Show as Therma-Tru, Larson, Fiberon, Fypon and Solar Innovations unite....

-
Faraday Future Founder and Co-CEO YT Jia Shares Weekly Investor Update: Addresses FF’s Market Performance and Will Announce an Improvement Plan for EAI Robotics and Recommend Major Changes for AIxC
LOS ANGELES--(BUSINESS WIRE)--Faraday Future Intelligent Electric Inc. (NASDAQ: FFAI) (“Faraday Future”, “FF” or the “Company”), a California-based global shared intelligent electric mobility ecosystem company, today shared a weekly business update from YT Jia, Founder and Global Co-CEO of FF. “Hello everyone! Happy Chinese New Year. Welcome back to our weekly report. Consistency speaks for itself, it's our commitment. A lot has changed over the past year. We've seen real, meaningful progress,...

-
F5, Inc. Deadline Tomorrow: Rosen Law Firm Urges F5, Inc. (NASDAQ: FFIV) Stockholders to Contact the Firm for Information About Their Rights
NEW YORK--(BUSINESS WIRE)--Rosen Law Firm, a global investor rights law firm, announces a class action lawsuit on behalf of purchasers of securities of F5, Inc. (NASDAQ: FFIV) between October 28, 2024 and October 27, 2025, inclusive (the “Class Period”). F5 is a global multicloud application security and delivery company. For more information, submit a form, email attorney Phillip Kim, or give us a call at 866-767-3653. The Allegations: Rosen Law Firm is Investigating the Allegations that F5, I...
-
ミュレンジア、電力消費なしのペット冷却ベッドでCIPS 2025イノベーション賞を受賞
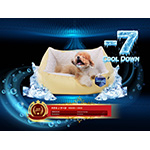
韓国ソウル--(BUSINESS WIRE)--(ビジネスワイヤ) -- 韓国の高級ペットライフスタイルブランド、ミュレンジアは、世界最大級のペット業界展示会の1つであるCIPS 2025で、先進的な「ウルトラ・クーリング・ペット・ベッド」が評価され、イノベーション賞を受賞しました。この受賞は、ペットの健康と快適さのための革新的で実用的なソリューションを生み出すというミュレンジアの取り組みを高く評価するものです。 日本をはじめとする各地で夏の気温が上昇している中、ペットの熱中症への懸念が高まっています。特に、体温が人間よりも高い猫や犬にとって、この問題は深刻です。ミュレンジアのペット冷却ベッドは、猛暑の中でもペットを涼しく保つための安全でエネルギー効率が高く、そして効果的な方法を提供することで、この問題に対処します。 電気料金の高騰が懸念されている日本においても、「ウルトラ・クーリング・ペット・ベッド」は、エアコンの設定温度を必要以上に下げることなく、ペットを快適かつ涼しく保つことができるとともに、エネルギー消費量の削減にも寄与します。 ミュレンジアは、独自の冷却技術を活用した新製品...
-
MUHLENGIA Wins CIPS 2025 Innovation Award for Zero-Electricity Pet Cooling Bed
SEOUL, South Korea--(BUSINESS WIRE)--Premium pet brand MUHLENGIA won the CIPS 2025 Innovation Award for its energy-efficient Ultra Cooling Pet Bed, designed to help prevent pet heatstroke...

-
Andersen Global consolide son offre en matière de mobilité internationale avec l'arrivée d'un nouveau cabinet membre
SAN FRANCISCO--(BUSINESS WIRE)--Andersen Global renforce sa présence en Suisse avec l'arrivée d'un nouveau cabinet membre, Exactio, consolidant ainsi son offre en matière de mobilité internationale et améliorant encore son modèle de services professionnels intégrés et multidisciplinaires. Exactio fournit des services personnalisés de conseil et de conformité en matière de mobilité internationale aux entreprises multinationales et aux personnes mobiles à l'échelle internationale. L'équipe expéri...