

Newsroom
Sorted by: Latest
-
Sangfor Technologies Included in the 2026 Gartner® Magic Quadrant™ for SASE Platforms
HONG KONG--(BUSINESS WIRE)--Sangfor’s inclusion in the 2026 Gartner® Magic Quadrant™ for SASE Platforms highlights Athena SASE as a strong global SASE alternative from Asia....
-
H2O.ai and CAN.B Group Partner to Advance Sovereign AI in Australia
CANBERRA, Australia--(BUSINESS WIRE)--H2O.ai, the sovereign enterprise AI platform for predictive, generative and agentic AI, with built-in observability and governance, today announced a strategic partnership with CAN.B Group, an Australian-owned technology and advisory company, to help government agencies, critical infrastructure operators and highly regulated organisations design, deploy and govern AI within Australian sovereign, regulatory and mission requirements. The partnership combines...
-
First Plus Expands Relationship with SS&C to Support Cross-Border Operations in APAC
WINDSOR, Conn.--(BUSINESS WIRE)--First Plus Expands Relationship with SS&C to Support Cross-Border Operations in APAC...
-
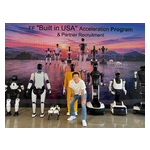
Faraday Future Global CEO YT Jia Shares Weekly Investor Update: Sets Another Monthly Robotics Sales Record, Launches the EAI Robotics “Built in USA” Acceleration Program, Previews the FF “Built in USA” Industry Chain Partner Recruitment Conference
LOS ANGELES--(BUSINESS WIRE)--Faraday Future Intelligent Electric Inc. (NASDAQ: FFAI) (“Faraday Future”, “FF” or the “Company”), a California-based global Embodied AI (EAI) ecosystem company, today shared a weekly business update from YT Jia, Founder and Global CEO of FF. “Hello from Weekly Report Issue 66. This week, I’d like to share our July sales campaign report, introduce FF EAI Robotics’ “Built in USA” Acceleration Program against the backdrop of the FCC’s new policies supporting the robo...
-
Lone Star Funds Acquires Multi-Family Residential Portfolio in Central Tokyo
DALLAS & NEW YORK & LONDON & TOKYO--(BUSINESS WIRE)--Lone Star Funds (“Lone Star”) today announced that an affiliate of Lone Star Real Estate Fund VII, L.P has successfully completed the acquisition of a multi-family residential portfolio (a total of 1,166 units) in central Tokyo. Located in the Shinkawa and Tsukuda submarkets of Chuo Ward in Central Tokyo, the portfolio consists of a 35-story, 505-unit residential tower and a separate campus of five buildings, four residential and one retail,...
-
CASH Investors Have Opportunity to Join Pathward Financial, Inc. Fraud Investigation with SBS Law
LOS ANGELES--(BUSINESS WIRE)--CASH Investors Have Opportunity to Join Pathward Financial, Inc. Fraud Investigation with SBS Law...
-
COLD Investors Have Opportunity to Join Americold Realty Trust, Inc. Fraud Investigation with SBS Law
LOS ANGELES--(BUSINESS WIRE)--COLD Investors Have Opportunity to Join Americold Realty Trust, Inc. Fraud Investigation with SBS Law...
-
CELC Investors Have Opportunity to Join Celcuity Inc. Fraud Investigation with SBS Law
LOS ANGELES--(BUSINESS WIRE)--CELC Investors Have Opportunity to Join Celcuity Inc. Fraud Investigation with SBS Law...
-
RBLX Investors Have Opportunity to Join Roblox Corporation Fraud Investigation with SBS Law
LOS ANGELES--(BUSINESS WIRE)--RBLX Investors Have Opportunity to Join Roblox Corporation Fraud Investigation with SBS Law...
-
Vedanta Aluminium Reports Record Q1 FY27 Performance; Profit Surges 205%, EBITDA More Than Doubles
MUMBAI, India--(BUSINESS WIRE)--Vedanta Aluminium Metal, one of the world's leading aluminium producers, today announced record financial results for the quarter ended June 30, 2026....