

Newsroom
Sorted by: Latest
-
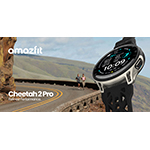
Amazfit dévoile la Cheetah 2 Pro, une montre de course haute performance conçue pour la préparation au marathon
MILPITAS, Californie--(BUSINESS WIRE)--Amazfit, marque mondiale leader dans le domaine des appareils portables intelligents détenue par Zepp Health, a annoncé aujourd’hui le lancement de la Cheetah 2 Pro, la dernière-née de sa gamme Cheetah axée sur la performance. Conçue pour les marathoniens qui considèrent que la préparation est essentielle, la Cheetah 2 Pro repose sur un principe simple : les performances au marathon dépendent du travail effectué par les coureurs tout au long de la semaine...

-
NetApp携手Google Cloud,赋能分布式云数据基础设施建设
美国加利福尼亚州圣何塞--(BUSINESS WIRE)--(美国商业资讯)-- 智能数据基础设施公司NetApp®(纳斯达克股票代码:NTAP)今日宣布,已与Google Cloud扩大合作,并签署为期四年的企业级协议,旨在加速NetApp存储解决方案在Google Distributed Cloud隔离环境(GDC)中的部署。该平台为由World Wide Technology(WWT)交付的Google主权云解决方案。在这一全栈、物理隔离的私有云解决方案中,NetApp数据平台提供内建安全能力,帮助企业在处理敏感信息的同时,有效满足数据主权相关要求。 NetApp总裁Cesar Cernuda表示:“对于政府机构及国防组织而言,敏感和涉密数据必须始终保留在受控环境之中,但这些数据同样是推动AI驱动决策的关键所在。通过将NetApp以安全为核心设计的存储系统深度整合至Google Distributed Cloud,我们正在助力客户构建智能数据基础设施,为在主权云及物理隔离环境中直接部署经认证的企业级AI奠定坚实基础。由此,公共部门客户得以在不牺牲安全性、合规性或国家主权的前提下,...
-
Andersen Consulting新增合作公司Nuvolar
旧金山--(BUSINESS WIRE)--(美国商业资讯)-- Andersen Consulting通过与Nuvolar签署合作协议拓展其数字化转型平台。Nuvolar是一家技术咨询公司,专注于基于云的软件开发和高级Salesforce实施服务。 Nuvolar成立于2008年,总部位于西班牙,提供端到端数字产品开发服务,在Salesforce、定制网页和移动应用、全栈开发、用户体验/界面设计、产品管理和长期支持服务方面拥有深厚专业知识。该公司在巴塞罗那、马德里、迈阿密和墨西哥城拥有超过110名专业人员,服务于航空、医疗保健、消费品、制药和酒店行业的客户,设计并部署可扩展的关键业务平台,从而优化运营并加速数字化转型。 Nuvolar首席执行官Marc Vivas表示:“与Andersen Consulting合作让我们能够更大规模地运用自身专业知识。作为一家注重工程技术的公司,我们期待携手合作,为客户提供创新、可靠和以用户为中心的数字解决方案,支持可持续增长和长期数字成熟度。” Andersen全球董事长兼首席执行官Mark L. Vorsatz表示:“Nuvolar凭借专业的工程...
-
Andersen Consulting adiciona a firma colaboradora Nuvolar
SAN FRANCISCO--(BUSINESS WIRE)--A Andersen Consulting expande sua plataforma de transformação digital através de um acordo de colaboração com a Nuvolar, consultoria de tecnologia especializada em desenvolvimento de software baseado na nuvem e implementações avançadas no Salesforce. A Nuvolar, fundada em 2008 e sediada na Espanha, fornece desenvolvimento de produtos digitais de ponta a ponta com expertise profunda no Salesforce, aplicativos móveis e para a web personalizados, desenvolvimento ful...
-
Amazfit stellt die Cheetah 2 Pro vor, eine leistungsstarke Sportuhr für die Vorbereitung auf Marathonläufe
MILPITAS, Kalifornien, USA--(BUSINESS WIRE)--Amazfit, eine weltweit führende Marke für Smart-Wearables im Besitz von Zepp Health, hat heute das Cheetah 2 Pro vorgestellt, das neueste Modell seiner leistungsorientierten Cheetah-Produktreihe. Die Cheetah 2 Pro wurde für Marathonläufer entwickelt, für die eine optimale Vorbereitung unverzichtbar ist. Ihr Design basiert auf einer klaren Überzeugung: Die Leistung beim Marathon hängt von der Trainingsarbeit ab, die Läufer während der Trainingswoche l...
-
Amazfit presenta el Cheetah 2 Pro, un reloj para correr de alto rendimiento pensado para la preparación de maratones
MILPITAS, California--(BUSINESS WIRE)--Amazfit, marca global líder en tecnología wearable de Zepp Health, anunció hoy el lanzamiento del Cheetah 2 Pro, la incorporación más reciente a su línea Cheetah enfocada en rendimiento. Pensado para corredores de maratón que saben que la preparación lo es todo, el nuevo dispositivo se basa en una idea central: el rendimiento en la distancia se construye durante cada semana de entrenamiento. El Cheetah 2 Pro integra entrenamientos estructurados, soporte pa...

-
Amazfit推出馬拉松訓練專用機能性跑步腕錶Cheetah 2 Pro
加州,米爾皮塔斯--(BUSINESS WIRE)--(美國商業資訊)-- Zepp Health旗下一流全球智慧穿戴設備品牌Amazfit今天為其首重機能表現的Cheetah系列推出新品Cheetah 2 Pro。Cheetah 2 Pro專為相信訓練是致勝關鍵的馬拉松跑者而設計,主張馬拉松的表現取決於跑者在訓練期間的作為。這款腕錶將精心規畫的跑步、體力輔助訓練與恢復分析整合為單一集中的訓練系統,協助跑者持之以恆、走過漫長的馬拉松準備期。Cheetah 2 Pro選擇在波士頓與倫敦馬拉松賽事前推出,專為滿足長里程數訓練與比賽當日的需求而設計。 Cheetah 2 Pro展現了Amazfit精進功能與輕質結構的理念,獻給那些深知里程數與分段成績不是提高速度的唯一條件,更關乎體力、恢復與自律的跑者。它根據混合訓練的原則,協助跑者培養耐力、體力及恢復能力,培養面對漫長的馬拉松準備期所需要的耐力與恆毅。 「馬拉松訓練的重點在於持之以恆、自我要求,以及全力面對準備過程中的每一個環節。在我準備參加波士頓馬拉松賽的時候,Cheetah 2 Pro幫助我為重要細節把關,從配速控制到恢復體能,百無一漏...

-
ネットアップ、グーグル・クラウドとの提携により、分散クラウド向けデータ・インフラストラクチャーを強化
米カリフォルニア州サンノゼ--(BUSINESS WIRE)--(ビジネスワイヤ) -- インテリジェント・データ・インフラストラクチャー企業のNetApp®(NASDAQ:NTAP)は、グーグル・クラウドとの提携を強化し、4年間のエンタープライズ契約を締結したことを発表しました。これにより、ワールド・ワイド・テクノロジー(WWT)が提供するグーグルのソブリン・クラウド・プラットフォーム「グーグル・ディストリビューテッド・クラウド(GDC)」のエアギャップ環境において、ネットアップのストレージ・ソリューションの展開を加速させることが可能となります。このフルスタック・エアギャップ型プライベート・クラウド・ソリューション内のネットアップのデータ・プラットフォームにより、機密情報の取り扱いおよびデータ主権要件への対応において組織が求める標準搭載のセキュリティー機能が提供されます。 ネットアップのプレジデントであるセサル・セルヌダは、「政府機関や防衛組織にとって、機密データは厳重管理された環境から漏れてはならない一方で、そうしたデータはAI主導の意思決定においても不可欠です」と述べ、「ネット...

-
Multi-Color Corporation anuncia a confirmação do plano de reorganização
ATLANTA--(BUSINESS WIRE)--A Multi-Color Corporation (“MCC” ou a “Empresa”), líder global em soluções de rótulos premium, anunciou hoje que o Tribunal de Falências dos Estados Unidos para o Distrito de Nova Jersey (o “Tribunal”) confirmou o plano de reorganização pré-acordado da Empresa (o “Plano”). A MCC espera sair do Capítulo 11 pré-acordado nas próximas semanas. Nos termos do Plano, a MCC concluirá uma reestruturação abrangente que reduzirá significativamente o endividamento da empresa e rec...
-
Multi-Color Corporation annonce la confirmation du plan de réorganisation
ATLANTA--(BUSINESS WIRE)--Multi-Color Corporation (« MCC » ou la « société »), le chef de file mondial des solutions d’étiquetage de haute qualité, annonce aujourd’hui que le tribunal des faillites des États-Unis pour le district du New Jersey (le « tribunal ») a confirmé le plan de réorganisation convenu d'avance de la société (le « plan »). MCC s'attend à sortir du plan convenu d'avance en vertu du Chapitre 11 dans les prochaines semaines. Selon les termes du plan, MCC réalisera une opération...