

Newsroom
Sorted by: Latest
-
Qube Research & Technologies LTD UK Regulatory Announcement: Form 8.3
LONDON--(BUSINESS WIRE)-- FORM 8.3 PUBLIC OPENING POSITION DISCLOSURE/DEALING DISCLOSURE BY A PERSON WITH INTERESTS IN RELEVANT SECURITIES REPRESENTING 1% OR MORE Rule 8.3 of the Takeover Code (the “Code”) 1. KEY INFORMATION (a) Full name of discloser: Qube Research & Technologies Limited (b) Owner or controller of interests and short positions disclosed, if different from 1(a): The naming of nominee or vehicle companies is insufficient. For a trust, the trustee(s), settlor and beneficiari...
-
Northern Trust Corporation Reports Second Quarter 2026 Financial Results
CHICAGO--(BUSINESS WIRE)--Northern Trust Corporation has released its second quarter 2026 financial results. Results can be found at https://www.northerntrust.com/about-us/investor-relations as well as on the corporation's Current Report on Form 8-K filed with the U.S. Securities and Exchange Commission (SEC) on July 22, 2026, which is available on the SEC's website at https://www.sec.gov. Webcast of Second Quarter Earnings Conference Call Northern Trust’s second quarter earnings conference cal...
-
Qube Research & Technologies LTD UK Regulatory Announcement: Form 8.3
LONDON--(BUSINESS WIRE)-- FORM 8.3 PUBLIC OPENING POSITION DISCLOSURE/DEALING DISCLOSURE BY A PERSON WITH INTERESTS IN RELEVANT SECURITIES REPRESENTING 1% OR MORE Rule 8.3 of the Takeover Code (the “Code”) 1. KEY INFORMATION (a) Full name of discloser: Qube Research & Technologies Limited (b) Owner or controller of interests and short positions disclosed, if different from 1(a): The naming of nominee or vehicle companies is insufficient. For a trust, the trustee(s), settlor and beneficiari...
-
AcuityMD Now Trusted By More Than 500 Medical Device Companies, Including 16 of Top 20
BOSTON--(BUSINESS WIRE)--AcuityMD, the AI platform for MedTech, today announced it is now trusted by more than 500 medical device (MedTech) companies, including 16 of the top 20, such as Becton Dickinson, Olympus, and Teleflex. The milestone reflects a growing shift across the medical device industry, as commercial teams adopt AI to better understand where care is happening and to uncover new opportunities. Across its customer base, AcuityMD has helped commercial teams generate billions in pipe...
-
Advyzon Launches Advyzon AI, the AI That Already Understands Advisors
CHICAGO--(BUSINESS WIRE)--Advyzon, a comprehensive wealth management technology and data platform for financial advisors and investment managers, today launched Advyzon AI, an embedded, agentic intelligence system built natively within the platform.Advyzon AI defines a new category of “All-in AI”: an operating model where intelligence is embedded across a unified platform, single data model, and cohesive architecture – rather than added through disconnected tools or integrations.Built on more th...
-
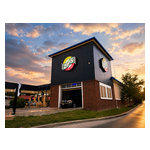
ZIPS Car Wash to Celebrate Renovated Kentucky Locations with Free Car Wash Weekend
LEXINGTON, Ky.--(BUSINESS WIRE)--ZIPS Car Wash is inviting drivers across Central Kentucky to celebrate the completion of renovations at three of its locations with a customer appreciation event featuring free car washes, ribbon-cutting ceremonies, exclusive membership offers, and Folds of Honor scholarship presentations. Free Washes will be offered Friday, July 24 and Saturday, July 25 at select locations. From July 24-25, guests can receive a complimentary car wash at the following remodeled...
-
NRG Energy, Inc. Announces Quarterly Dividend
HOUSTON--(BUSINESS WIRE)--NRG Energy, Inc. (NYSE: NRG) today announced that its Board of Directors declared a quarterly dividend on the Company’s common stock of $0.475 per share, or $1.90 per share on an annualized basis. The dividend is payable on August 17, 2026, to stockholders of record as of August 3, 2026. About NRG NRG is a leading provider of electricity, natural gas, and smart home solutions to eight million customers across North America. The company operates a customer-first platfor...
-
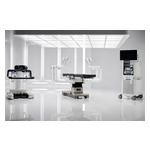
Johnson & Johnson Receives FDA Market Authorization in the U.S. for its OTTAVA™ Robotic Surgical System
NEW BRUNSWICK, N.J.--(BUSINESS WIRE)--Johnson & Johnson today announced that the U.S. Food and Drug Administration (FDA) has granted De Novo authorization for the OTTAVA™ Robotic Surgical System, the world’s first table-integrated soft tissue robotic system. The system received marketing authorization for multiple procedures in general surgery, including Roux-en-Y gastric bypass, gastrectomy, cholecystectomy, splenectomy, gastric sleeve, small bowel resection, appendectomy, lysis of adhesio...
-
BostonGene and Kyoto University Establish Strategic Partnership to Advance Biomarker Discovery for Combination Immunotherapy
TOKYO & WALTHAM, Mass.--(BUSINESS WIRE)--BostonGene, the developer of the leading AI model for tumor and immune biology, today announced a strategic research partnership with Kyoto University, a research institution known for its groundbreaking advancements in medicine and science. The partnership supports a multicenter, Phase II clinical trial led by Dr. Manabu Muto of Kyoto University, evaluating the safety and efficacy of a combined therapeutic approach using immune checkpoint inhibitors (IC...