

Newsroom
Sorted by: Latest
-
Second Front Achieves NATO UNCLASSIFIED ATO, Deploys DIANA Mission-Critical Platform in 17 Days
LONDON--(BUSINESS WIRE)--Second Front Achieves NATO UNCLASSIFIED ATO, Deploys DIANA Mission-Critical Platform in 17 Days...
-
PipeChain übernimmt das niederländische Supply-Chain-Softwareunternehmen Quyntess, baut seine globale Präsenz aus und stärkt seine Kompetenzen im Bereich der durchgängigen Digitalisierung
STOCKHOLM--(BUSINESS WIRE)--PipeChain, ein globaler Anbieter von cloudbasierter Collaborative Planning & Execution-Software für große multinationale Unternehmen sowie von Multi-Enterprise-Netzwerklösungen für die Automobil- und Einzelhandelsbranche, gab heute die Übernahme des niederländischen Supply-Chain-Softwareunternehmens Quyntess Holding B.V. („Quyntess“, https://www.quyntess.com) bekannt, mit etablierten Niederlassungen in den Benelux-Ländern, Deutschland, Frankreich und den USA. Das...

-
PipeChain neemt Nederlands supply chain-softwarebedrijf Quyntess over, breidt wereldwijde positie uit en versterkt end-to-end digitaliseringsmogelijkheden
STOCKHOLM--(BUSINESS WIRE)--PipeChain, een wereldwijde leverancier van cloudgebaseerde Collaborative Planning & Execution-software voor grote multinationale ondernemingen en Multi-Enterprise Network-oplossingen voor de automotive- en retailsector, heeft vandaag de overname aangekondigd van het Nederlandse supply chain-softwarebedrijf Quyntess Holding B.V. (“Quyntess”, https://www.quyntess.com/), met operaties in de Benelux, Duitsland, Frankrijk en de Verenigde Staten. De gecombineerde organ...

-
PipeChain Acquires Dutch Supply Chain Software Company Quyntess, Expanding Global Footprint and Strengthening End-to-End Digitalization Capabilities
STOCKHOLM--(BUSINESS WIRE)--PipeChain, a global provider of cloud-based Collaborative Planning & Execution software for large multinational companies and Multi-Enterprise Network solutions for the automotive and retail industries, today announced the acquisition of the Dutch supply chain software company Quyntess Holding B.V. (“Quyntess”, https://www.quyntess.com/) with established operations in the Benelux region, Germany, France, and the United States. The combined entity will reach sales...

-
mimik Launches mimOE Studio to Accelerate Agentix-Native Systems with Sustainable Economics and Scalable Growth
OAKLAND, Calif.--(BUSINESS WIRE)--mimOE Studio, the first Agentix-Native Workstation, enabling enterprises to build, operate and scale agents with certainty....

-
Brenus Pharma Announces FDA Acceptance of IND Application for STC-1010 (BreAK-CRC001) in MSS Metastatic Colorectal Cancer (mCRC)
LYON, France--(BUSINESS WIRE)--Brenus Pharma, a clinical stage biotechnology company developing novel in vivo immunotherapies for solid tumors, announced that the U.S. Food and Drug Administration (FDA) has accept the company's Investigational New Drug (IND) application for its first drug candidate, STC-1010, in microsatellite stable (MSS) metastatic colorectal cancer (mCRC). STC-1010 is designed to address a critical unmet need worldwide. Approximately 95% of mCRC patients have MSS tumors, whi...
-
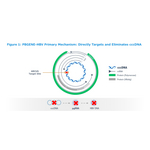
Precision BioSciences Announces New and Late-Breaking PBGENE-HBV Clinical Data from the ELIMINATE-B Study at European Association for the Study of the Liver Congress 2026
DURHAM, N.C.--(BUSINESS WIRE)--Precision BioSciences, Inc. (Nasdaq: DTIL), a clinical stage gene editing company utilizing its novel proprietary ARCUS® platform to develop in vivo gene editing therapies for high unmet need diseases, today announced the presentation of new and late-breaking clinical data from the ELIMINATE-B study evaluating PBGENE-HBV at the European Association for the Study of the Liver (EASL) Annual Congress 2026. The late-breaking data, titled ‘First evidence of elimination...
-
バイオサイトジェン、AI駆動型「RenSuper™」プラットフォームと業界初となる完全自動の抗体創薬インフラを発表
中国・北京--(BUSINESS WIRE)--(ビジネスワイヤ) -- バイオサイトジェンは、実験的に検証済みの完全ヒト治療用抗体配列から成る大規模な既製ライブラリーを利用できる次世代のAI駆動型抗体創薬プラットフォーム「RenSuper Workstation」と、抗体検証・製造の加速を目的に設計された完全自動インフラ「RenSuper High-Throughput Antibody Manufacturing Automation Center」を発表しました。 バイオサイトジェン独自のRenMice® プラットフォーム群を基盤として、RenSuperは、生体内免疫レパートリー、AIによる候補選定、自動化された実験検証、拡張可能な製造インフラを組み合わせたクローズド・ループ型抗体創薬エンジンを構築します。同プラットフォームにより、モノクローナル抗体、二重特異性抗体、多重特異性抗体、抗体薬物複合体(ADC)、VHH抗体、その他の高度な治療モダリティーの創薬・開発が支援され、抗体創薬に伴う所要時間とリスクを大幅に削減できます。 RenSuper Workstation:AI駆動型...
-
Deutsche Bank AG UK Regulatory Announcement: FRN Variable Rate Fix
LONDON--(BUSINESS WIRE)-- Commonwealth Bank of Australia Issue of AUD 13,000,000.00 Floating Rate Notes due 24 February 2032 Series no 6455 Tranche 1 MTN ISSUE NAME. Our Ref. MO4624 ISIN Code. XS2448367800 TOTAL INTEREST AMT. CURRENCY CODE. AUD DAY BASIS. ACTUAL/365 FIXED (A005) NUM OF DAYS. 90 INTEREST RATE. 5.3459 PCT VALUE DATE. 24/08/2026 INTEREST PERIOD. 26/05/2026 TO 24/08/2026 AUD 171,361.73 POOL FACTOR. N/A...
-
Pershing Square Holdings, Ltd. UK Regulatory Announcement: Transaction in Own Shares
LONDON--(BUSINESS WIRE)-- Pershing Square Holdings, Ltd. Announces Transactions in Own Shares - 26 May 2026 Pershing Square Holdings, Ltd. (LN:PSH) (LN:PSHD) (“PSH”) today announced that it has purchased, through PSH’s agent, Jefferies International Limited (“Jefferies”), the following number of PSH’s Public Shares of no par value (ISIN Code: GG00BPFJTF46) (the "Shares"): Total Buyback Ticker/s: PSH (LSE); PSHD (LSE) Date of Purchase: 26 May 2026 Number of Public Shares Purchased: 21,830 Sha...