

Newsroom
Sorted by: Latest
-
TelevisaUnivision presenta los resultados del cuarto trimestre y del ejercicio 2025 completo
MIAMI--(BUSINESS WIRE)--TelevisaUnivision, la empresa de medios de comunicación en español líder a nivel mundial, anunció hoy los resultados financieros correspondientes al cuarto trimestre y del ejercicio completo cerrado el 31 de diciembre de 2025. Visite el sitio web de Relaciones con los inversores de la empresa en investors.televisaunivision.com para consultar los resultados financieros y los materiales sobre las ganancias. TelevisaUnivision realizará hoy una conferencia telefónica para pr...
-
Investor Notice: Robbins LLP Informs Investors of the Lakeland Industries, Inc. Class Action Lawsuit
SAN DIEGO--(BUSINESS WIRE)--Robbins LLP informs stockholders that a class action was filed on behalf of all investors who purchased or otherwise acquired Lakeland Industries, Inc. (NASDAQ: LAKE) securities between December 1, 2023 and December 9, 2025. Lakeland, together with its subsidiaries, manufactures and sells industrial protective clothing and accessories for the industrial and public protective clothing market worldwide. For more information, submit a form, email attorney Aaron Dumas, J...

-
AM Best Revises Outlooks to Stable and Affirms Credit Ratings of Mercury General Corporation and Its Subsidiaries
OLDWICK, N.J.--(BUSINESS WIRE)--AM Best has revised the outlooks to stable from negative and affirmed the Financial Strength Rating of A (Excellent) and the Long-Term Issuer Credit Ratings (Long-Term ICR) of “a” (Excellent) for the members of Mercury Casualty Group (Mercury). Concurrently, AM Best has revised the outlook to stable from negative and affirmed the Long-Term ICR of “bbb” (Good) of the organization’s publicly traded ultimate parent, Mercury General Corporation (MGC) (Los Angeles, CA...
-
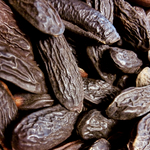
LMR推出零陵香豆CO₂萃取原精:环保萃取工艺铸就美食香氛杰作
法国格拉斯--(BUSINESS WIRE)--(美国商业资讯)-- 全球领先的香水、化妆品和香精天然原料供应商IFF (NYSE: IFF) 旗下LMR Naturals by IFF宣布,将零陵香豆二氧化碳萃取原精加入其“Conscious Collection”系列。该系列包含12种高度可持续且可追溯的天然原料,专为香水和香精而设计。零陵香豆二氧化碳萃取原精是一种具有美食调独特香气的天然萃取物。这款全新原料采用可再生和回收的超临界二氧化碳,产于IFF位于法国奥布拉克的萃取基地。 “我们在奥布拉克的二氧化碳萃取装置助力LMR开发出一系列完美融合了可持续与高愉悦度特性的萃取物,是调香师的理想之选。”LMR Naturals by IFF总经理Bertrand de Préville表示,“零陵香豆二氧化碳萃取原精的推出再次凸显了我们对环保型超临界二氧化碳萃取和香水创新的承诺,并进一步巩固了我们在高端香水原料领域的领先地位。” 全新的零陵香豆萃取物具有更优的性能和成本效益。与传统的溶剂萃取相比,二氧化碳萃取工艺降低了能耗,从而减少了对环境的影响。该工艺在低温下进行,无任何石油化学残留物...
-
Riassunto: Axelera AI si assicura un finanziamento di oltre 250 milioni di dollari per la crescita commerciale globale
EINDHOVEN, Paesi Bassi--(BUSINESS WIRE)--Axelera AI, il leader europeo nell'hardware di accelerazione dell'intelligenza artificiale, ha annunciato l'ultimo round di finanziamento condotto da Innovation Industries, con la partecipazione di fondi e account di punta, tra cui BlackRock e SiteGround Capital come nuovi investitori, oltre agli investitori esistenti Bitfury, CDP Venture Capital, European Innovation Council Fund, Federal Holding and Investment Company of Belgium (SFPIM), Invest-NL, Sams...
-
Samenvatting: Axelera AI verzekert een financiering van meer dan $250 miljoen voor wereldwijde commerciële groei
EINDHOVEN, Nederland--(BUSINESS WIRE)--Axelera AI, de Europese leider in AI-versnellingshardware, kondigde haar nieuwste financieringsronde aan, geleid door Innovation Industries, met deelname van prominente fondsen en accounts waaronder BlackRock en SiteGround Capital als nieuwe investeerders, evenals de bestaande investeerders Bitfury, CDP Venture Capital, European Innovation Council Fund, Federal Holding & Investment Company of Belgium (SFPIM), Invest-NL, Samsung Catalyst Fund en Verve I...
-
Resumen: Axelera AI obtiene más de 250 millones de dólares en financiamiento para crecimiento comercial global
EINDHOVEN, Países Bajos--(BUSINESS WIRE)--Axelera AI, líder europeo en hardware de aceleración para IA, anunció su ronda de financiamiento más reciente a cargo de Innovation Industries, con participación de importantes fondos y cuentas, entre ellas BlackRock y SiteGround Capital como nuevos inversores, además de los inversores existentes Bitfury, CDP Venture Capital, el Fondo del Consejo Europeo de Innovación, la Sociedad Federal de Holdings e Inversiones (SFPIM) de Bélgica, Invest-NL, Samsung...
-
LMR推出採用關懷地球技術萃取的頂級香基「東加豆CO₂精萃」
法國,格拉斯--(BUSINESS WIRE)--(美國商業資訊)-- IFF (NYSE: IFF) 旗下製造香水、化妝品和風味香料用天然原料的全球先驅LMR Naturals by IFF為其Conscious系列推出新品「東加豆CO₂精萃」(Tonka Bean CO₂ Absolute)。Conscious系列共有12款高度永續且可追溯來源的天然原料,用於製作香水和食品香料。帶有頂級香氣、天然萃取的「東加豆CO₂精萃」是香氣魔法師的新寵,在IFF位於法國奧布拉克 (Aubrac) 的萃取廠循環利用再生超臨界二氧化碳生產製作。 「本公司位於奧布拉克的萃取設備幫助LMR無縫融合永續性及愉悅感受,為調香師開發一系列萃取香基。」LMR Naturals by IFF總經理Bertrand de Préville說,「東加豆CO₂精萃的推出再次重申我們使用關懷地球超臨界二氧化碳萃取技術與創新香調的承諾,證明我們用頂級天然原料製作優質香調的領先地位。」 這款新東加豆精粹以更出色的表現與成本效益為號召。與傳統溶劑萃取方式相比,它所使用的二氧化碳萃取流程可降低耗能、減少環境衝擊。在低溫環境中製...

-
Prime Healthcare Services, Inc. Schedules 2025 4th Quarter Earnings Conference Call
ONTARIO, Calif.--(BUSINESS WIRE)--Prime Healthcare Services will report earnings the morning of March 17, 2026, to be followed by a conference call at 2:00 p.m. (ET) to discuss the reported results. Please ensure you pre-register prior to the call by emailing EGarcia27@primehealthcare.com to facilitate attaining your individual pin that will allow direct access to the call. Access to the call will not be available to those who have not registered in advance. For those who are unable to listen t...

-
Samenvatting: Infobip en ESA verbeteren waarschuwingen voor asteroïde-inslagen met directe spraakoproepen
VODNJAN, Kroatië--(BUSINESS WIRE)--Infobip, het wereldwijde cloudcommunicatieplatform, gaat samenwerken met het Europees Ruimteagentschap (ESA) om verbeteringen aan te brengen in het leveren van meldingen over asteroïde-inslagen via de Voice API-oplossingen van Infobip.. Met behulp van het platform van Infobip ontvangen ESA-medewerkers nu directe spraakoproepen. Zo kunnen zij 24 uur per dag, 7 dagen per week sneller voor mogelijke asteroïde-inslagen worden gewaarschuwd. Het is van cruciaal bela...
