Newsroom
Sorted by: Latest
-
ExaGrid تعلن عن تسجيل أفضل النتائج الربع سنوية في تاريخها من حيث قيمة الحجوزات والإيرادات
مارلبورو، ماساتشوستس--(BUSINESS WIRE)--أعلنت ExaGrid®، أكبر مورّد مستقل في العالم لحلول تخزين النسخ الاحتياطي، والتي تقدِّم نظام التخزين المتعدد الطبقات للنسخ الاحتياطي مع أعلى مستويات الأمان وتقنية قفل مدة الاحتفاظ المدعومة بالذكاء الاصطناعي لاستعادة البيانات من برامج الفدية، اليوم عن أنها حققت أفضل أداء ربعي في تاريخها من حيث الحجوزات والإيرادات خلال الربع الثاني المنتهي في 30 يونيو 2026، مسجلةً نموًا في الإيرادات بنسبة مزدوجة الرقم مقارنةً بالربع الثاني من عام 2025، إلى جانب تحقيق نمو في الإي...
-
PNR Investors Have Opportunity to Join Pentair plc Fraud Investigation with the Schall Law Firm
LOS ANGELES--(BUSINESS WIRE)--PNR Investors Have Opportunity to Join Pentair plc Fraud Investigation with the Schall Law Firm...
-
UTZ Investors Have the Opportunity to Join Investigation of Utz Brands, Inc. with the Schall Law Firm
LOS ANGELES--(BUSINESS WIRE)--UTZ Investors Have the Opportunity to Join Investigation of Utz Brands, Inc. with the Schall Law Firm...
-
越境ECサイト「WAFUU.COM」、公式キャラクター“Mochi”を発表
東京--(BUSINESS WIRE)--(ビジネスワイヤ) -- 日本の商品を世界へ届ける越境ECサイト「WAFUU.COM」は、本日、公式キャラクター「Mochi(モチ)」を発表しました。Mochiは、WAFUU.COMを通じて日本の魅力的な商品と出会う楽しさを、やさしく、親しみやすく伝えていく存在です。今後はWAFUU.COMのサイト、SNS、キャンペーン、同梱物、各種クリエイティブを通じて、世界中のファンとのコミュニケーションを担います。 デビュームービーは公式サイトで公開中です。 ▶ Mochi公式サイト:https://mochi.wafuu.com/ 1. Mochiについて Mochiは、“日本の商品を選ぶ楽しさ”そのものを象徴するキャラクターとして誕生しました。やわらかく丸みのあるシルエット、やさしい表情、印象に残るチャームポイントを持ち、初めてWAFUU.COMを訪れる方にも、すでに日本のカルチャーを愛する方にも自然に寄り添うデザインを目指しています。ブランドの世界観を視覚的に伝えるだけでなく、「また会いたい」「保存したい」「シェアしたい」と感じてもらえる存在にな...

-
Securities Fraud Investigation Into America's Car-Mart, Inc. (CRMT) Continues – Shareholders Who Lost Money Urged to Contact The Law Offices of Frank R. Cruz
LOS ANGELES--(BUSINESS WIRE)--The Law Offices of Frank R. Cruz continues its investigation of America's Car-Mart, Inc. (“Car-Mart” or the “Company”) (NASDAQ: CRMT) on behalf of investors concerning the Company’s possible violations of federal securities laws.IF YOU ARE AN INVESTOR WHO LOST MONEY ON AMERICA'S CAR-MART, INC. (CRMT), CLICK HERE TO INQUIRE ABOUT POTENTIALLY PURSUING A CLAIM TO RECOVER YOUR LOSS.What Is the Investigation About?On July 15, 2025, Car-Mart disclosed it would delay filin...
-
Footprint erweitert sein Sortiment um PE-freie Becher und bringt damit eine bewährte, recycelbare und im Haushalt kompostierbare Alternative zu mit Kunststoff beschichteten Papierbechern in die Produktion
GILBERT, Arizona--(BUSINESS WIRE)--Footprint, ein auf die Eliminierung von Einwegkunststoffen spezialisiertes Unternehmen im Bereich Materialwissenschaft und -technologie, gab heute bekannt, dass es von Transcend Packaging eine Plattform für recycelbare, im Hauskompost verwertbare und polyethylenfreie (PE-freie) Heiß- und Kaltgetränkebecher sowie Lösungen der nächsten Generation für Papierdeckel und Trinkhalme erworben hat. Transcend Packaging ist ein europäisches Unternehmen, das sich auf Inno...

-
Footprint breidt uit naar PE-vrije bekers en neemt productie van een bewezen, recyclebaar en thuis composteerbaar alternatief voor papieren bekers met plastic coating in gebruik
GILBERT, Ariz.--(BUSINESS WIRE)--Footprint, een bedrijf gespecialiseerd in materiaalwetenschap en -technologie dat zich richt op het uitbannen van plastic voor eenmalig gebruik, heeft vandaag de overname aangekondigd van een platform voor PE-vrije (polyethyleenvrije) bekers voor warme en koude dranken van Transcend Packaging. Ook de bijbehorende innovatieve oplossingen voor papieren deksels en rietjes maken deel uit van de overname. Transcend Packaging is een Europees bedrijf dat zich richt op...
-
Labaton Keller Sucharow LLP Files Securities Class Action Against Primoris Services Corporation
NEW YORK--(BUSINESS WIRE)--Labaton Keller Sucharow LLP (“Labaton”) has filed a securities class action lawsuit (the “Action”) on behalf of its clients Boston Retirement System (“Boston”) and NS Pension Public Equity Fund (“NS Pension”) against Primoris Services Corporation (“Primoris” or the “Company”) (NYSE: PRIM) and certain Primoris officers and directors (collectively, “Defendants”). The Action, which is captioned Boston Retirement System v. Primoris Services Corp., No. 26-cv-02416-B (N.D. T...
-
Footprint amplía su presencia a los vasos sin polietileno y lanza la producción de una alternativa demostrada, reciclable y compostable en el hogar a los vasos de cartón revestidos de plástico
GILBERT, Arizona--(BUSINESS WIRE)--Footprint, una empresa de tecnología y ciencia de materiales que se dedica a eliminar plásticos de un solo uso, anunció hoy la adquisición de una plataforma de vasos para bebidas calientes y frías reciclables, compostables en el hogar y sin polietileno (PE) a Transcend Packaging, junto con soluciones de tapas y sorbetes de cartón de próxima generación. Transcend Packaging es una empresa europea que se dedica a la innovación en soluciones de envasado sostenible...

-
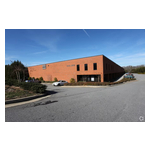
SouthEast Computer Recyclers’ Expansion Deepens Nationwide Footprint as IT Asset Disposition Specialists
ALPHARETTA, Ga.--(BUSINESS WIRE)--SouthEast Computer Recyclers (SECR) has announced an expansion of its services with its new facility at 351 Curie Drive in Alpharetta, Ga. The center broadens SECR’s capabilities as an IT Asset Disposition (ITAD) and e-waste recycling partner, offering enterprise organizations, government agencies, educational institutions, data centers, and end users across the United States a secure, audited path for retiring servers, laptops, hard drives, and other end-of-li...