

Newsroom
Sorted by: Latest
-
Trulioo lanciert KI-Agent zur Erfassung des wirtschaftlichen Eigentums bei mangelhaften globalen Eigentumsregistern
SAN DIEGO--(BUSINESS WIRE)--Trulioo, eine globale Risk-Intelligence-Plattform, stellte heute den UBO Discovery Agent vor, die neueste Komponente der UBO Discovery-Funktion von Trulioo in dessen Workflow für die Geschäftsrisiken- und Know Your Business(KYB)-Verifizierung. KI gestaltet die Betrugslandschaft um und macht es böswilligen Akteuren leichter, sich zu verstecken, und Unternehmen schwerer, diese Akteure zu fassen. Dadurch wird der bereits komplizierte Job, zu überprüfen, wem ein Unterneh...
-
ZoomInfo’s Data Says Jersey Mike's Franchise System Is Consolidating Fast Ahead of Its IPO
VANCOUVER, Wash.--(BUSINESS WIRE)--ZoomInfo (NASDAQ: GTM), the all-in-one AI GTM Platform, has confirmed a new analysis showing Jersey Mike's franchise system consolidating into the hands of large, multi-unit operators ahead of the sandwich chain's planned initial public offering. ZoomInfo’s proprietary franchise dataset maps ownership across more than 600,000 United States franchise locations spanning 3,000-plus brands, resolving each one to its operating owner and the decision-makers inside i...

-
KW Announces Key Leadership Appointments to Accelerate Growth
AUSTIN, Texas--(BUSINESS WIRE)--KW announces key leadership appointments to accelerate agent count growth, franchise productivity, and KW Commercial expansion....

-
Comstock Properties Earn 2026 Kingsley Excellence Awards
RESTON, Va.--(BUSINESS WIRE)--Comstock Holding Companies, Inc. (Nasdaq: CHCI) (“Comstock”), a leading real estate company specializing in the development, acquisition, operation, and management of mixed-use, transit-oriented properties and data center developments, today announced that seven of its managed commercial properties have received 2026 Kingsley Excellence Awards, a prestigious recognition for delivering exceptional service to tenants and maintaining outstanding levels of overall tena...
-
L3Harris Announces Quarterly Dividend
MELBOURNE, Fla.--(BUSINESS WIRE)--The Board of Directors of L3Harris Technologies (NYSE: LHX) has declared a quarterly cash dividend of $1.25 per common share, payable Sept. 18, 2026, to shareholders of record as of the close of business on Sept. 4, 2026. About L3Harris Technologies L3Harris is the Trusted Disruptor in defense tech. With customers’ mission-critical needs always in mind, our employees deliver end-to-end technology solutions connecting the space, air, land, sea and cyber domains...
-
Thyora Therapeutics Launches to Build a Next-Generation Platform for Covalent Drug Discovery
TAMPA, Fla.--(BUSINESS WIRE)--Thyora Therapeutics today emerged from stealth as a biotechnology company leveraging next-generation covalent chemistry, with a mission to accelerate clinical translation and create therapies for high-unmet medical needs. Founded on breakthrough discoveries published today in Science by scientists at Moffitt Cancer Center, the company is advancing an integrated platform that combines novel covalent chemistry with AI-enabled chemoproteomics to unlock a new generatio...

-
TelevisaUnivision anuncia los resultados del segundo trimestre de 2026
MIAMI--(BUSINESS WIRE)--TelevisaUnivision, la empresa de medios de comunicación en español líder en el mundo, anunció hoy sus resultados financieros del segundo trimestre de 2026, finalizado el 30 de junio de 2026. Visite el sitio web de Relaciones con Inversionistas de la compañía en investors.televisaunivision.com para ver los resultados financieros y los materiales sobre ganancias. La compañía realizará una teleconferencia hoy a las 11:00 h, ET, / 8:00 h, PT, para analizar los resultados. La...
-
TelevisaUnivision anuncia resultados do segundo trimestre de 2026
MIAMI--(BUSINESS WIRE)--A TelevisaUnivision, empresa líder mundial em mídia em espanhol, anunciou hoje seus resultados financeiros do segundo trimestre de 2026, encerrado em 30 de junho de 2026. Visite o site de Relações com Investidores da empresa em investors.televisaunivision.com para visualizar os resultados financeiros e materiais de divulgação. A empresa realizará uma teleconferência hoje, às 11h (horário do leste dos EUA) / 8h (horário do Pacífico), para discutir os resultados. A telecon...

-
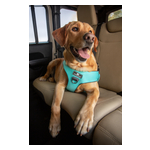
New Sleepypod Rebrand Signals the Next Chapter of Protecting Pets
DENVER--(BUSINESS WIRE)--Sleepypod®, a pioneer in crash-tested pet travel safety products, today announces a comprehensive rebrand signaling a new chapter for the brand. This new chapter is rooted in one singular mission – “Protecting What Matters.” Launching with a newly designed website, Sleepypod will offer enhanced safety education, more product-testing insights, and a deep history of real-world accounts from car crash survivors protected by Sleepypod pet safety restraints. As an industry p...
-
Kaskela Law LLC Announces Investigation of Amneal Pharmaceuticals, Inc. (AMRX) and Encourages AMRX Shareholders to Contact the Firm
PHILADELPHIA--(BUSINESS WIRE)--Kaskela Law is investigating Amneal Pharmaceuticals, Inc. (Nasdaq: AMRX) (“Amneal”) on behalf of the company’s current shareholders. The investigation seeks to determine whether Amneal or the company’s officers and/or directors violated the securities laws or breached their fiduciary duties in connection with recent corporate actions. Amneal shareholders are encouraged to contact Kaskela Law LLC (D. Seamus Kaskela, Esq. or Adrienne Bell, Esq.) for additional infor...