

Newsroom
Sorted by: Latest
-
Number of Shares and Voting Rights of Innate Pharma as of April 9, 2026
MARSEILLE, France--(BUSINESS WIRE)--Number of shares and voting rights of Innate Pharma as of April 9, 2026...

-
L’assemblée générale d’Innate Pharma aura lieu le 21 mai 2026
MARSEILLE--(BUSINESS WIRE)--Regulatory News: Innate Pharma SA (Euronext Paris : IPH ; Nasdaq : IPHA) (« Innate » ou la « Société ») annonce la tenue de son assemblée générale annuelle le 21 mai 2026 à 10h30 au siège social de la Société, situé au 117, avenue de Luminy à Marseille (9ème arrondissement). L’avis de réunion, publié le 13 avril 2026, au Bulletin des annonces légales obligatoires contient l’ordre du jour, le texte des projets de résolutions, ainsi que les modalités de participation e...

-
Innate Pharma to Hold Its Annual General Meeting of Shareholders on May 21, 2026
MARSEILLE, France--(BUSINESS WIRE)--Innate Pharma to hold its annual general meeting of shareholders on May 21, 2026...

-
Nouveau nombre d’actions et de droits de vote d’Innate Pharma au 9 avril 2026
MARSEILLE, France--(BUSINESS WIRE)--Regulatory News: Conformément aux articles L. 233-8 II du Code de Commerce et 223-16 du règlement général de l’Autorité des marchés financiers (l’« AMF »), Innate Pharma SA (Euronext Paris : IPH ; Nasdaq : IPHA) (« Innate » ou la « Société ») publie le nombre d’actions composant son capital social ainsi que le nombre de droits de vote associés au 9 avril 2026 : Nombre d’actions composant le capital : 93 860 680 actions dont : 93 847 763 5 336 7 581 actions or...

-
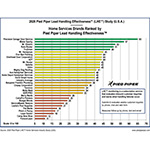
Precision Garage Door Ranked #1 in Customer Lead Handling Effectiveness™ Home Services Study
AUSTIN, Texas--(BUSINESS WIRE)--Precision Garage Door Service ranked #1 in Home Services Lead Handling Effectiveness™ Study, measuring interaction and follow-up with new customers....
-
Faraday Future Founder and Co-CEO YT Jia Shares Weekly Investor Update: Twelve More EAI Robots Shipped, with Plans to Share More Progress and Milestones in Building FF’s EAI Education Ecosystem Coming Next Week
LOS ANGELES--(BUSINESS WIRE)--Faraday Future Intelligent Electric Inc. (NASDAQ: FFAI) (“Faraday Future,” “FF” or the “Company”), a California-based global Embodied AI (EAI) ecosystem company, today shared a weekly business update from YT Jia, Founder and Global Co-CEO of FF. This week’s update will be in the form of a Q&A session with YT. “Q1: YT, how has the recent delivery progress of your robotics business been? A1: The progress has been quite solid. As you can see, the R&D team behi...

-
AM Best to Deliver Reinsurance-Related Presentations to Shanghai International Reinsurance Exchange Members
SINGAPORE--(BUSINESS WIRE)--AM Best will deliver a pair of presentations as part of a half-day seminar with members of the Shanghai International Reinsurance Exchange (SIRE), scheduled to take place on 22 April 2026, in Shanghai, China. Rob Curtis, managing director and chief executive officer of AM Best’s Singapore operations, and Judy Li, market development analyst, will lead the presentations. The first is titled, “The Role of Credit Ratings in Reinsurance,” and the second is “How Credit Rat...
-
Rosen Law Firm Encourages Wing Yip Food Holdings Group Limited Investors to Inquire About Securities Class Action Investigation – WYHG
NEW YORK--(BUSINESS WIRE)--Why: Rosen Law Firm, a global investor rights law firm, announces an investigation of potential securities claims on behalf of shareholders of Wing Yip Food Holdings Group Limited (NASDAQ: WYHG) resulting from allegations that Wing Yip Food Holdings may have issued materially misleading business information to the investing public. So what: If you purchased Wing Yip Food Holdings securities you may be entitled to compensation without payment of any out of pocket fees...
-
Rosen Law Firm Encourages Linkers Industries Limited Investors to Inquire About Securities Class Action Investigation – LNKS
NEW YORK--(BUSINESS WIRE)--Why: Rosen Law Firm, a global investor rights law firm, announces an investigation of potential securities claims on behalf of shareholders of Linkers Industries Limited (NASDAQ: LNKS) resulting from allegations that Linkers Industries may have issued materially misleading business information to the investing public. So what: If you purchased Linkers Industries securities you may be entitled to compensation without payment of any out of pocket fees or costs through a...
-
プロバスケットボール選手 八村塁選手が、次世代アスリートのための特別イベント「BLACK SAMURAI SUMMIT 2026」を開催
東京--(BUSINESS WIRE)--(ビジネスワイヤ) -- 先進的なチケッティングおよびライブイベント・テクノロジーのリーディングカンパニーであるAXS Japan(AXS Japan合同会社:東京都渋谷区、代表:石川元樹)は本日、プロバスケットボール選手・八村塁選手が主催する第2回目となる特別イベント「BLACK SAMURAI SUMMIT 2026」の公式チケッティングパートナーを務めることを発表しました。 「BLACK SAMURAI SUMMIT 2026」は、日本のバスケットボールを世界の舞台へと押し上げることを目的に実施されるプロジェクトであり、次世代のプレイヤーとファンにインスピレーションを提供するトレーニングキャンプと、その集大成として開催される特別イベントで構成されます。 『BLACK SAMURAI』は、世界最高峰の舞台で活躍する八村塁選手と、その後に続くことを志す日本の次世代アスリートをつなぐ象徴的なプロジェクトです。ファンとの交流や実践的な指導を通じて、八村選手は、世界トップレベルで競い合うために求められる高度なスキル、万全の準備、そして揺るぎない精...
