Newsroom
Sorted by: Latest
-
First Trust Global Funds PLC UK Regulatory Announcement: Net Asset Value(s)
LONDON--(BUSINESS WIRE)-- Funds Date TIDM ISIN Code Shares in Issue Currency Net Asset Value NAV/per Share First Trust Bloomberg Nuclear Power UCITS ETF 24.07.2026 RCTR.LN IE000J5PESP7 1,700,002.00 USD 30,068,203.37 17.687 ...
-
Enhanced Applauds FDA Advisory Committee's Landmark Vote to Expand Legal Compounding Pathway for Peptides
NEW YORK--(BUSINESS WIRE)--Enhanced Group Inc. (NYSE: ENHA) the elite sports competition and personalized performance products company commended the United States Food & Drug Administration’s (FDA) Pharmacy Compounding Advisory Committee (PCAC) for its vote last week recommending that BPC-157, KPV, TB-500, MOTS-c, Epitalon and Semax be added to the FDA's Section 503A Bulk Drug Substances List. This recommendation is a critical step toward providing licensed U.S. compounding pharmacies a leg...

-
OPAL Fuels Announces Second Quarter 2026 Earnings Release Date and Conference Call
WHITE PLAINS, N.Y.--(BUSINESS WIRE)--OPAL Fuels (Nasdaq: OPAL) a leader in the production, marketing, and distribution of renewable and compressed natural gas (RNG and CNG) used as a transportation fuel for heavy duty trucking, today announced that it will release its earnings results for the second quarter ended June 30, 2026, before market open on Monday, August 10, 2026. A conference call will take place on Monday, August 10, 2026 at 11:00 a.m. Eastern Time.A listen-only connection to the inv...
-
PROCEPT BioRobotics Corporation Sued for Securities Law Violations - Contact the DJS Law Group to Discuss Your Rights – PRCT
LOS ANGELES--(BUSINESS WIRE)--PROCEPT BioRobotics Corporation Sued for Securities Law Violations - Contact the DJS Law Group to Discuss Your Rights – PRCT...
-
EVelution Energy Confirms Substantial Groundwater Resources for First Commercial-scale Cobalt Processing Facility in the U.S.
YUMA, Ariz.--(BUSINESS WIRE)--EVelution Energy confirms substantial groundwater resources, further de-risking its planned solar-powered cobalt processing facility in Arizona....
-
Arrowhead Pharmaceuticals Completes Enrollment in Global Phase 3 YOSEMITE Study of Zodasiran for the Treatment of Homozygous Familial Hypercholesterolemia
PASADENA, Calif.--(BUSINESS WIRE)--Arrowhead Pharmaceuticals, Inc. (NASDAQ: ARWR) today announced that it has completed enrollment in the global Phase 3 YOSEMITE clinical trial of zodasiran, the company’s investigational RNA interference (RNAi) therapeutic being developed as a potential treatment for homozygous familial hypercholesterolemia (HoFH), a rare genetic condition that leads to severely elevated low density lipoprotein-cholesterol (LDL-C) and early onset cardiovascular disease. Arrowhe...
-
Schrödinger Introduces Bunsen, an AI Co-Scientist for Molecular Discovery
NEW YORK--(BUSINESS WIRE)--Schrödinger, Inc. today announced the launch of its early access version of Bunsen, its new agentic AI co-scientist....
-
Antares Raises $470M Series C to Deploy Nuclear Microreactors for Critical Missions
TORRANCE, Calif.--(BUSINESS WIRE)--Antares has raised $470 million in Series C funding, co-led by Paradigm and Caffeinated Capital, with participation from Point72 Ventures, Shine Capital, Industrious Ventures, and others. The round accelerates Antares' path from a demonstrated reactor to fielded power systems for defense and space, with initial deployments to U.S. military installations beginning by 2028. "Jordan and the Antares team just achieved the first private advanced reactor criticality...
-
First Trust Global Funds PLC UK Regulatory Announcement: Net Asset Value(s)
LONDON--(BUSINESS WIRE)-- Funds Date TIDM ISIN Code Shares in Issue Currency Net Asset Value NAV/per Share First Trust Europe Rising Dividend Achievers UCITS ETF 24.07.2026 EDVY.LN IE000CPG9HG3 50,002.00 EUR 1,124,840.52 22.496 ...
-
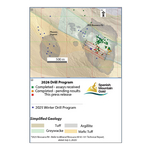
Spanish Mountain Gold Expands Mineralization Intersecting 252.3 Meters of 0.82 g/t Gold Including 93.5 Meters of 1.32 g/t Gold as Part of Its Feasibility Study Drill Program
VANCOUVER, British Columbia--(BUSINESS WIRE)--Spanish Mountain Gold Ltd. (the “Company” or “Spanish Mountain Gold”) (TSX-V: SPA) (FSE: S3Y) (OTCQB: SPAUF) is pleased to provide assay results recently received for ten diamond drill holes on the Spanish Mountain Gold project (the “Project”), located in the Cariboo Gold Corridor, British Columbia, Canada. Approximately 18,500 meters (“m”) of a planned 60,000 m 2026 Feasibility Drill Program have been completed to date. This news release presents a...