

Newsroom
Sorted by: Latest
-
日本酒造組合中央会:日本酒の輸出成長が継続、2025年に世界81市場を記録
東京--(BUSINESS WIRE)--(ビジネスワイヤ) -- 2025年の日本酒輸出は、金額・数量ともに堅調に拡大し、輸出先の国・地域数は過去最高の81に達した。輸出金額は前年比6%増の459億円、数量は前年比8%増の3,355万リットル(373万ケース 9L換算)となり、いずれも歴代2位の実績を記録した。一方で、750ml当たりの平均輸出単価は前年比2%減の1,026円となった。 日本酒の輸出は、近年著しい成長を遂げている。2020年と比較すると輸出金額は約2倍に増加し、直近5年間の年平均成長率(CAGR)は14%に達しており、世界のアルコール市場において日本酒は高い成長性を持つカテゴリーといえる。 地域別では、アジアが最大の輸出先で、輸出金額は288億円、前年比8%増、構成比は63%を占めた。北米は124億円で前年比1%減となり、地域別では唯一前年を下回った。中南米は現時点での輸出額は限定的だが、2020年と比べると市場規模は約4倍に拡大しており、輸出先国数も初めて10か国に到達した。 国別では、中国が最大の輸出先で、輸出金額は133億円、前年比14%増と好調だった。一方、...

-
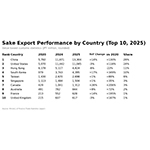
JSS: 2025 Sake Exports Grew Steadily, Reaching a Record 81 Markets
TOKYO--(BUSINESS WIRE)--Sake exports continued to expand in 2025 in both value and volume, with export destinations reaching a record 81 countries and regions. Export value increased 6% year on year to 45.9 billion yen, while export volume rose 8% to 33.55 million liters (3.73 million cases on a 9-liter basis), marking the second-highest export performance on record. The average export unit price per 750 ml bottle declined 2% year on year to 1,026 yen. Export value has nearly doubled since 2020...
-
Ultragenyx Pharmaceutical Inc. Notice of April 6, 2026 Application Deadline for Class Action Lawsuit - Contact Lewis Kahn, Esq. at Kahn Swick & Foti, LLC, Before Application Deadline
NEW YORK & NEW ORLEANS--(BUSINESS WIRE)--Kahn Swick & Foti, LLC (“KSF”) and KSF partner, former Attorney General of Louisiana, Charles C. Foti, Jr., notifies investors in Ultragenyx Pharmaceutical Inc. (“Ultragenyx” or the “Company”) (NasdaqGS: RARE) of a class action securities lawsuit. CLASS DEFINITION: The lawsuit seeks to recover losses on behalf of investors of Ultragenyx who were adversely affected by alleged securities fraud between August 3, 2023 and December 26, 2025. Follow the li...

-
RARE Investors Have Opportunity to Lead Ultragenyx Pharmaceutical Inc. Securities Fraud Lawsuit with the Schall Law Firm
LOS ANGELES--(BUSINESS WIRE)--RARE Investors Have Opportunity to Lead Ultragenyx Pharmaceutical Inc. Securities Fraud Lawsuit with the Schall Law Firm...
-
LTIMindtree reconhecida como líder na Avaliação PEAK Matrix® 2025 para serviços de TI de pagamento do Everest Group
MUMBAI, Índia & WARREN, New Jersey--(BUSINESS WIRE)--A LTIMindtree [NSE: LTIM, BSE: 540005], fornecedora líder global em soluções digitais e consultoria tecnológica, se posicionou como líder na Avaliação PEAK Matrix® 2025 para serviços de TI de pagamento do Everest Group. Esse reconhecimento se deve por ser um parceiro em transformação estratégica que combina escala em modernização, alianças de plataforma, inovação em tempo real e ativos digitais, e garante ambientes de pagamento seguros e pron...

-
LTIMindtree reconocido como Líder en la Evaluación PEAK Matrix® 2025 de Everest Group sobre servicios de TI para pagos
MUMBAI, India y WARREN, Nueva Jersey--(BUSINESS WIRE)--LTIMindtree [NSE: LTIM, BSE: 540005], proveedor líder a nivel mundial de consultoría tecnológica y soluciones digitales, ha sido posicionado como Líder en la Evaluación PEAK Matrix® 2025 de Everest Group sobre servicios de TI para pagos. Este reconocimiento se otorga por ser un socio estratégico en la transformación que combina escala de modernización, alianzas con plataformas e innovación en activos digitales en tiempo real, y garantiza en...

-
LTIMindtree als führendes Unternehmen in der PEAK Matrix®-Bewertung 2025 der Everest Group für IT-Dienstleistungen im Zahlungsverkehr ausgezeichnet
MUMBAI, Indien & WARREN, New Jersey--(BUSINESS WIRE)--LTIMindtree [NSE: LTIM, BSE: 540005], ein weltweit führender Anbieter von Technologieberatung und digitalen Lösungen, wurde als führendes Unternehmen in der Everest Group Payments IT Services PEAK Matrix® Assessment 2025. positioniert. Diese Auszeichnung würdigt LTIMindtree als strategischen Transformationspartner, der Modernisierungsmaßnahmen, Plattformallianzen und Innovationen in Echtzeit und im Bereich digitaler Assets kombiniert und sic...

-
Riassunto: LTIMindtree riconosciuta come Leader nella Valutazione PEAK Matrix® dei servizi di pagamento IT di Everest Group per il 2025
MUMBAI, India e WARREN, N.J.--(BUSINESS WIRE)--LTIMindtree [NSE: LTIM, BSE: 540005], un fornitore leader globale di consulenza tecnologica e soluzioni digitali, è stato posizionato come Leader nella Valutazione PEAK Matrix® dei servizi di pagamento IT di Everest Group per il 2025. Il riconoscimento premia l'azienda per essere un partner strategico innovativo che unisce modernizzazione su larga scala, alleanze tra piattaforme e innovazione in tempo reale, asset digitali e garantisce ambienti di...

-
LTIマインドツリー、Everest Group「Payments IT Services PEAK Matrix® Assessment 2025」でリーダーに選定
インド・ムンバイおよび米ニュージャージー州ウォーレン--(BUSINESS WIRE)--(ビジネスワイヤ) -- LTIマインドツリー[NSE:LTIM、BSE:540005]はグローバルにテクノロジー・コンサルティングとデジタル・ソリューションを提供するすることで有名ですが、同社はEverest Groupの「Payments IT Services PEAK Matrix® Assessment 2025」においてリーダーに選定されました。本評価は、近代化を大規模に推進する力、プラットフォーム企業との提携、リアルタイム領域およびデジタル資産領域におけるイノベーションを組み合わせ、安全で規制当局の要件に備えた決済環境の実現を支援する「戦略的変革パートナー」としての取り組みが評価されたものです。 Everest Groupは発行会社、加盟店管理会社、決済処理事業者、カードネットワーク、フィンテック企業にまたがる大規模決済の領域で、LTIマインドツリーが強い市場影響力を持ち、ビジョンと提供能力を備えている点を評価しました。企業が、リアルタイム決済、クロスボーダー決済、ISO 2002...
-
LTIMindtree在Everest Group 2025年支付领域IT服务PEAK Matrix®评估中被评为领导者
印度孟买和新泽西州沃伦--(BUSINESS WIRE)--(美国商业资讯)-- 全球领先的技术咨询与数字解决方案提供商LTIMindtree [NSE: LTIM, BSE: 540005]在Everest Group 2025年支付领域IT服务PEAK Matrix®评估中被评为领导者。这一认可旨在表彰其作为战略转型合作伙伴,将现代化规模、平台联盟和实时数字资产创新相结合,并确保安全、符合监管要求的支付环境。 Everest Group特别肯定了LTIMindtree在为发卡机构、收单机构、支付处理商、卡组织和金融科技企业提供大规模支付解决方案方面的强大市场影响力、远见卓识和卓越能力。此次评估正值企业加速对传统支付平台进行现代化改造,以支持实时支付、跨境支付和符合ISO 20022标准的支付环境,同时提升系统韧性、互操作性与合规水平。 LTIMindtree凭借其卓越的产品工程专业能力脱颖而出,涵盖Finastra GPP/P2G等主流支付平台以及领先的信用卡平台和资金转账系统,并以卓越中心和全球转型项目为支撑。Everest Group还强调了LTIMindtree在支付枢纽现代...
